Two companies become one. The engineering half has run the Scaled Agile Framework® (SAFe®) for years, with a portfolio, a Solution Train and Agile Release Trains. The digital half works in product teams with their own rhythm. Soon several thousand people share one software department, and all of them need to understand how it fits together.
Leadership asks for a glance at the whole portfolio. Everyone else asks a simpler question: where do I belong? Which team, which train, who is my Release Train Engineer, who is my line manager, and which teams do we depend on?
Both answers fit on one Peerdom map. This article shows a fictional industrial group, Valdora Drives, layer by layer, and then looks at what research says about scaling agile.
The whole department at a glance
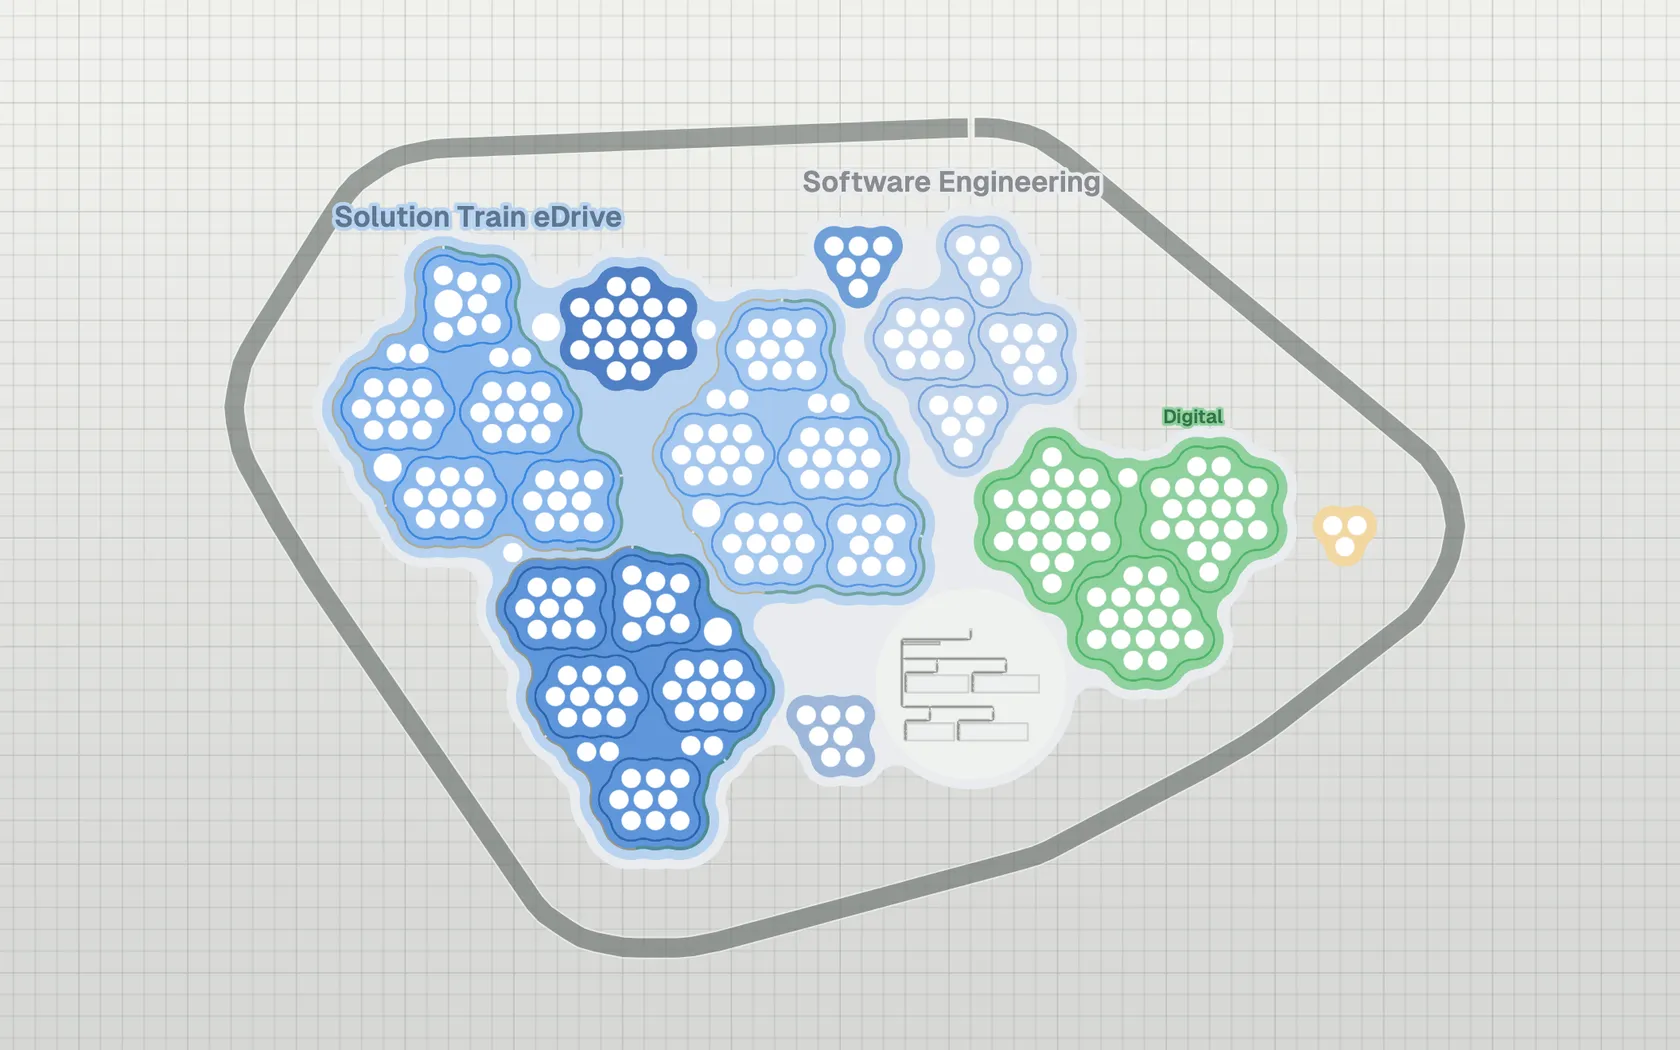
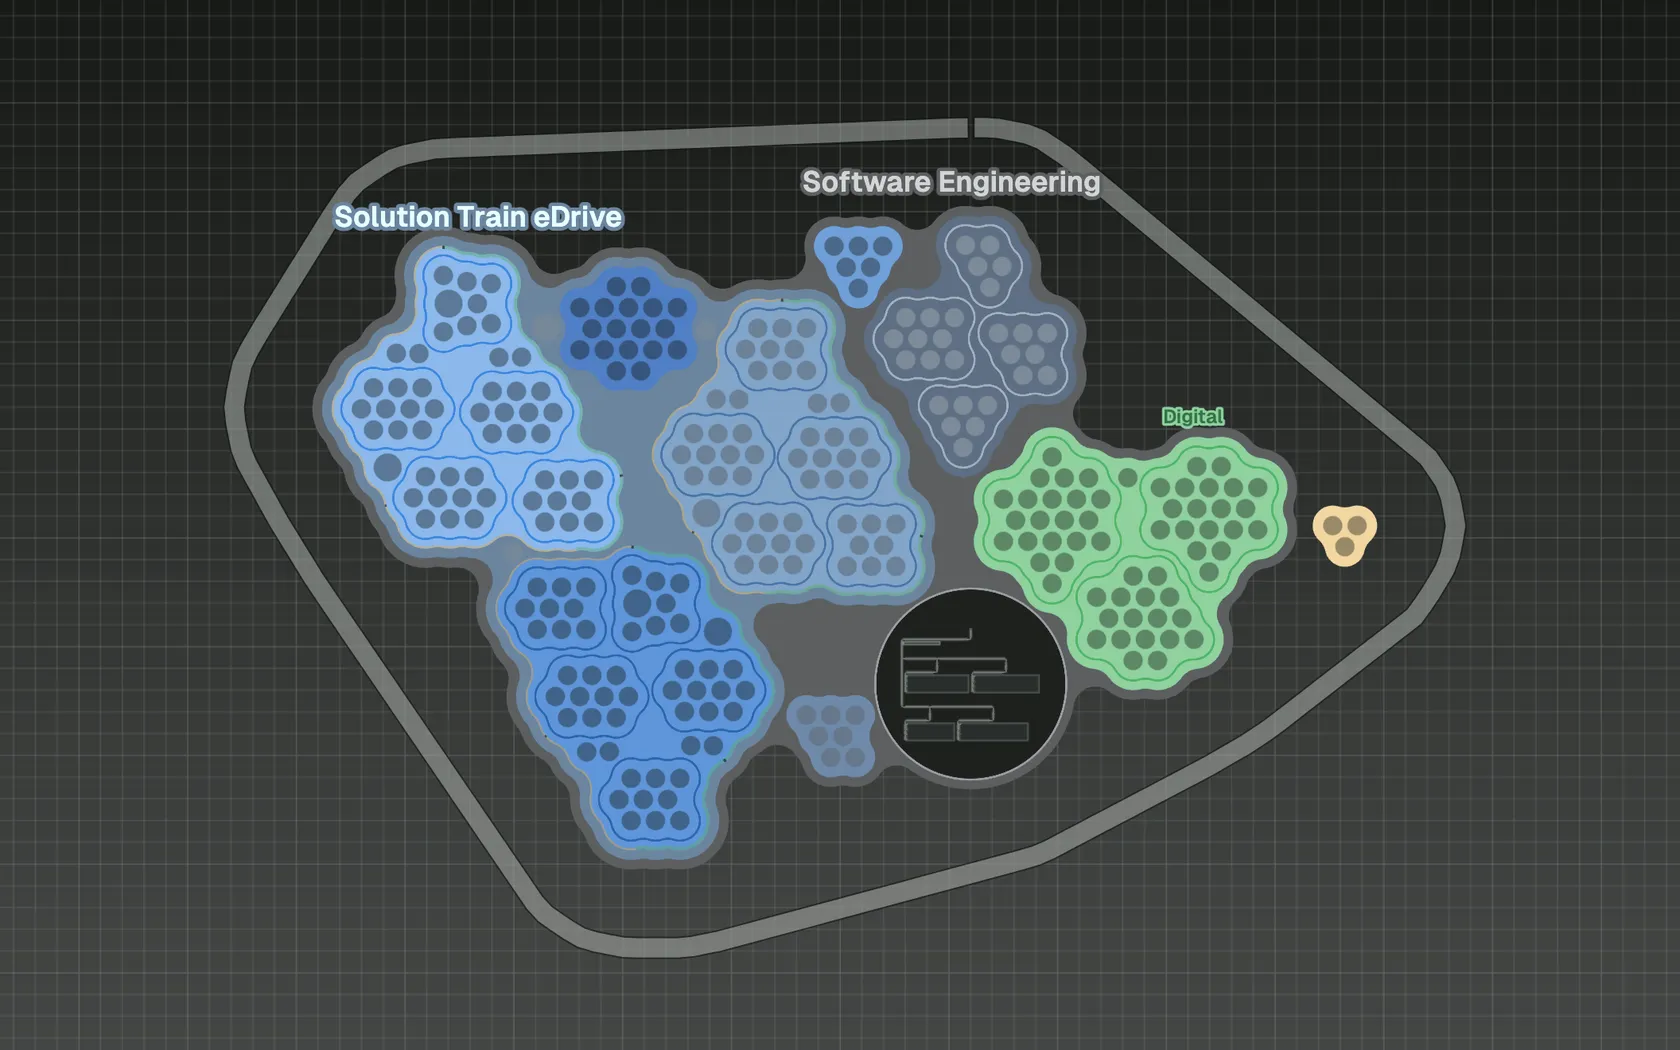
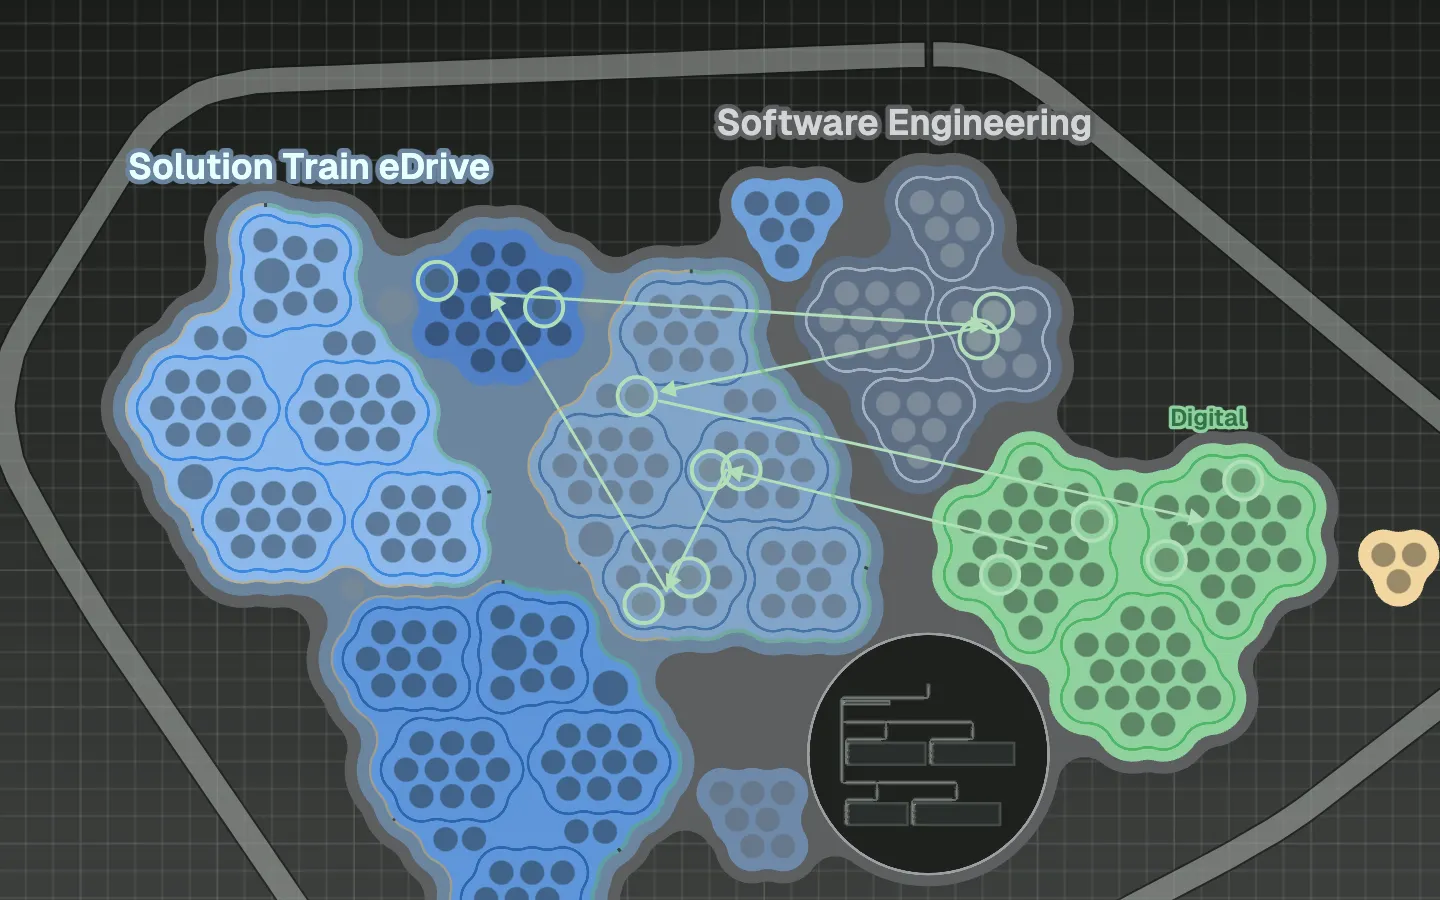
Valdora Drives builds electric drive systems for rail and industry. Its Software Engineering department brings both halves together: a SAFe portfolio with the Solution Train eDrive and three Agile Release Trains (ARTs), and a Digital unit with three product teams. 271 people, one map.
Colors carry the story: blue for the trains and everything that serves them, green for Digital, gray for the line organization. A leader sees the size of each train, where the Shared Services sit, and which work runs across both halves.
SAFe is a dual operating system
SAFe borrows a well-known idea. Scaled Agile describes SAFe as a second, virtual operating system organized around value streams, running next to the functional hierarchy. The term comes from John Kotter’s dual operating system: a hierarchy that runs the business, and a network beside it that moves fast.
SAFe describes two complementary structures: the trains people work in and the hierarchy they report through. A shared map can show both together. We wrote about this pattern in Every Organization Is Two Organizations.
SAFe, layer by layer
Practitioners know the questions a big framework raises. Each one has a place on the map.
Portfolio. Lean Portfolio Management is a group with its own roles: Portfolio Owner, two Epic Owners, an Enterprise Architect, a Lean Budget Lead and an Operational Excellence Lead.
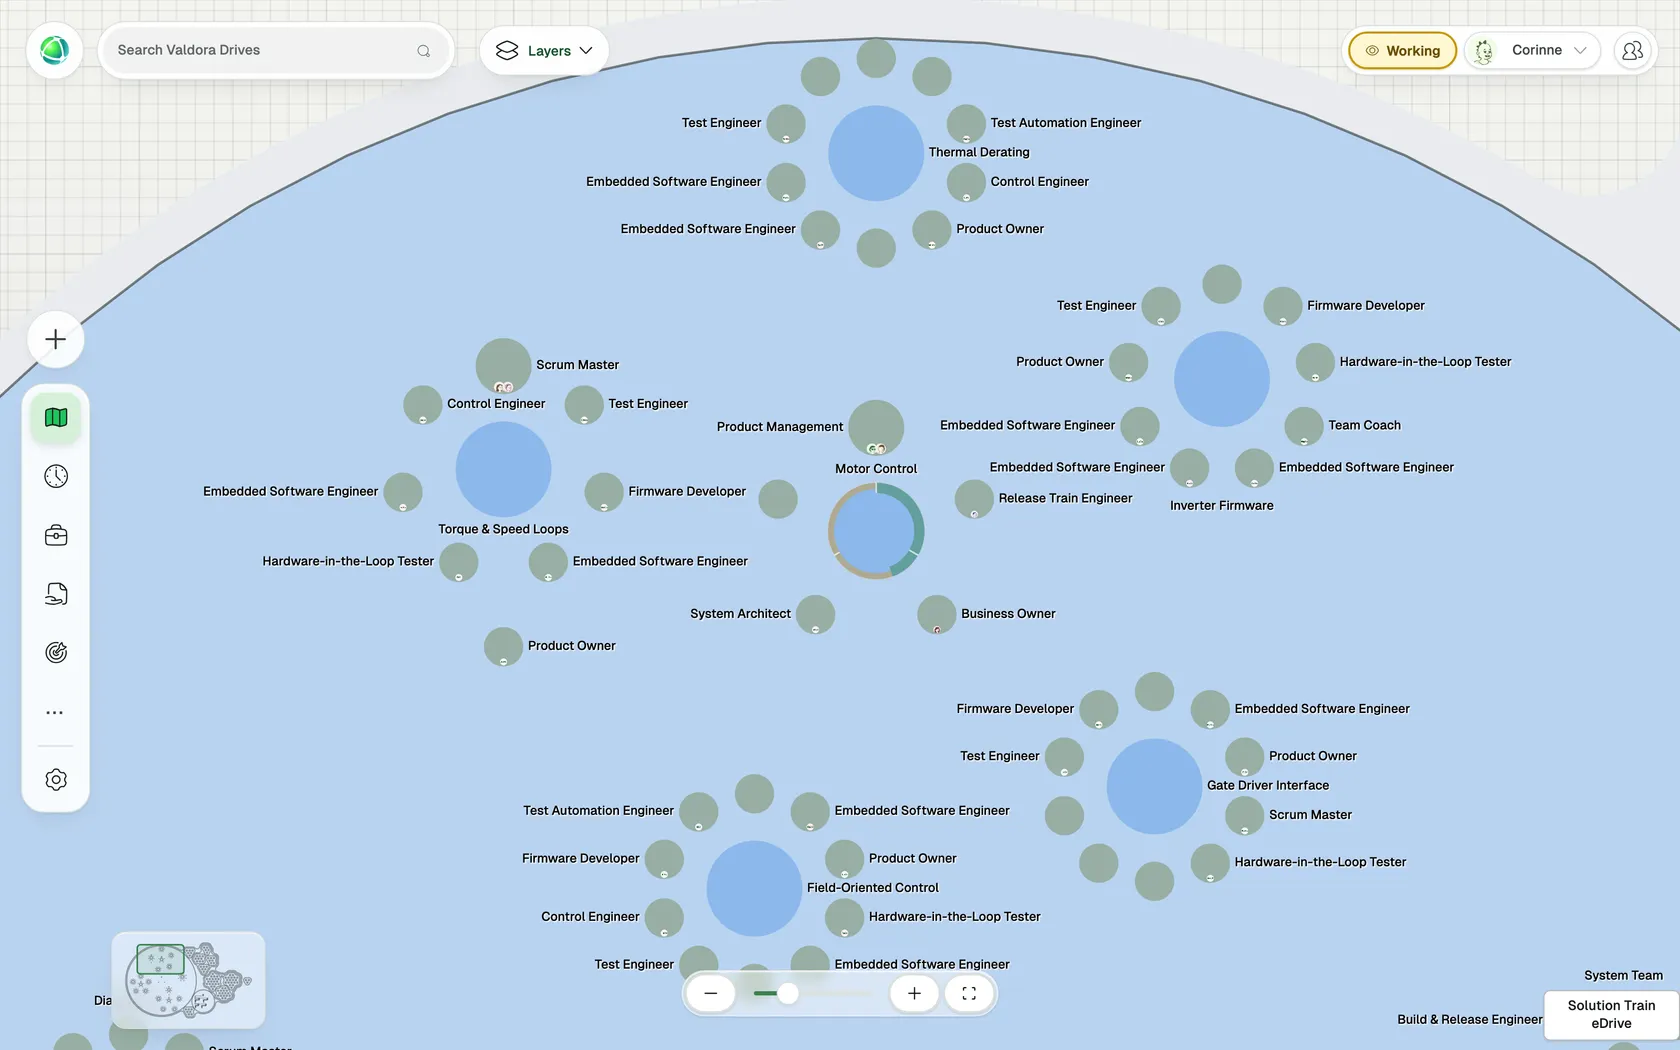
Solution Train and ARTs. The Solution Train eDrive holds its Solution Train Engineer, Solution Management and Solution Architect. Inside it sit Motor Control, Battery and Diagnostics, each with a Release Train Engineer, Product Management, a System Architect and two Business Owners, by name. Each ART has five agile teams with a Product Owner, a Scrum Master or Team Coach, and the developers and testers.
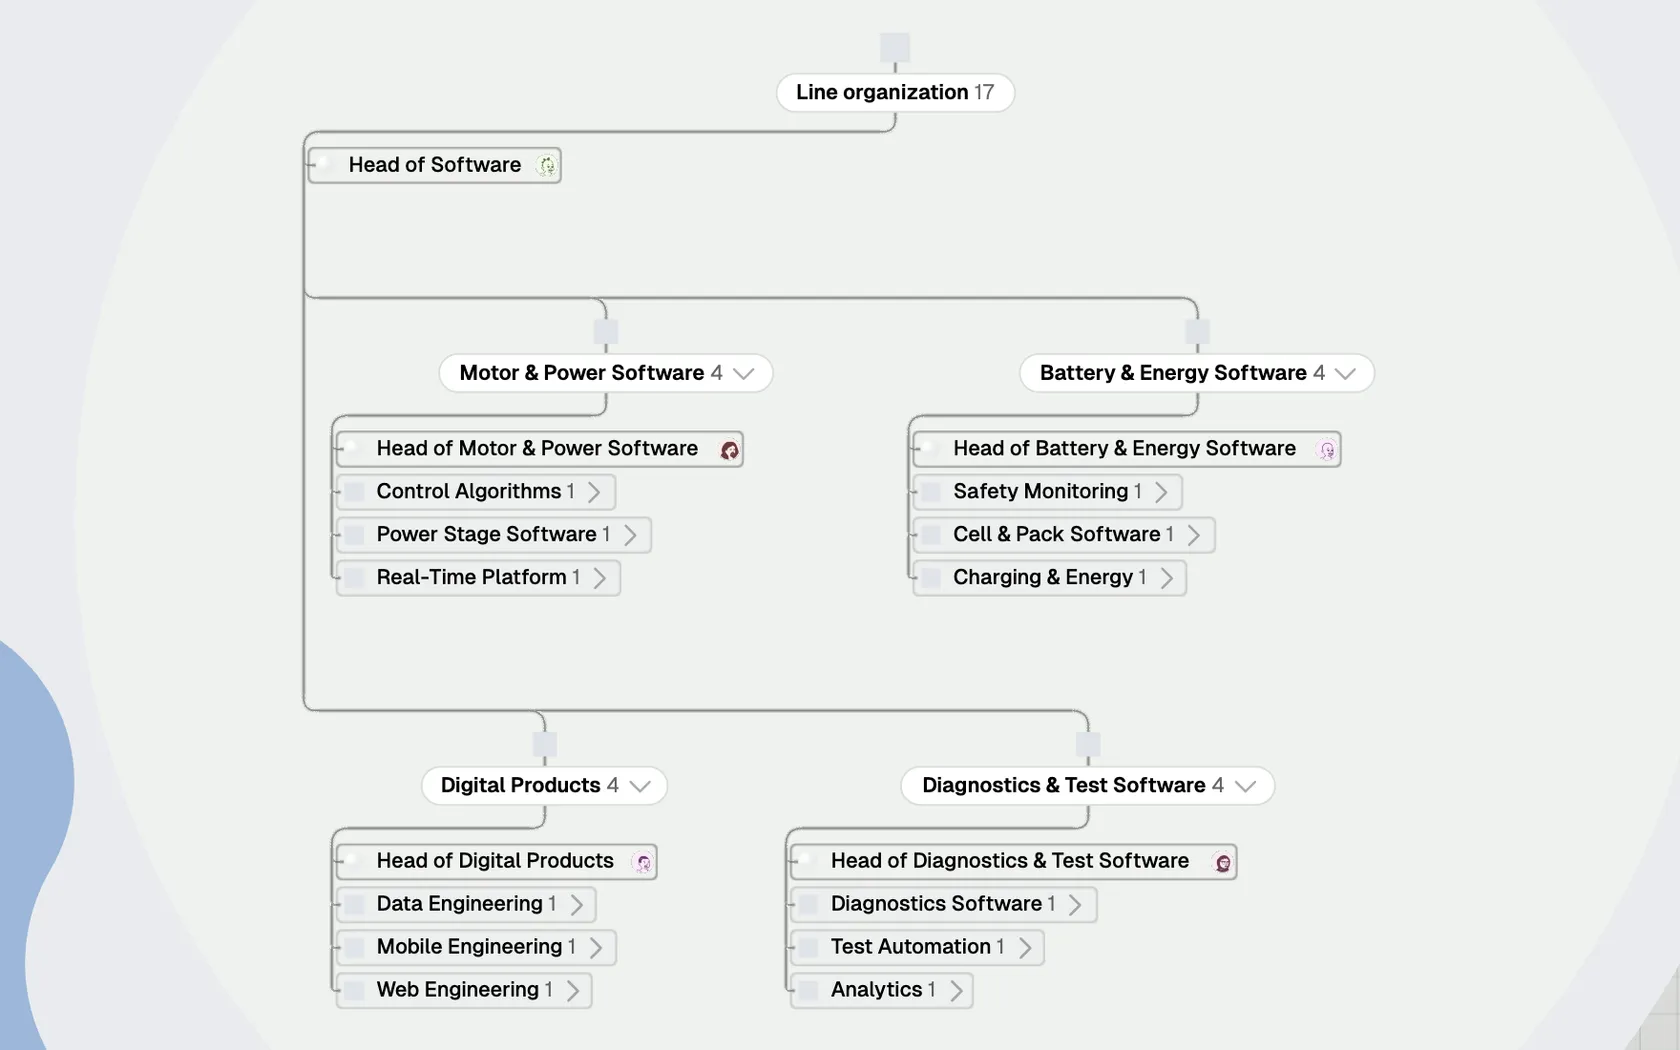
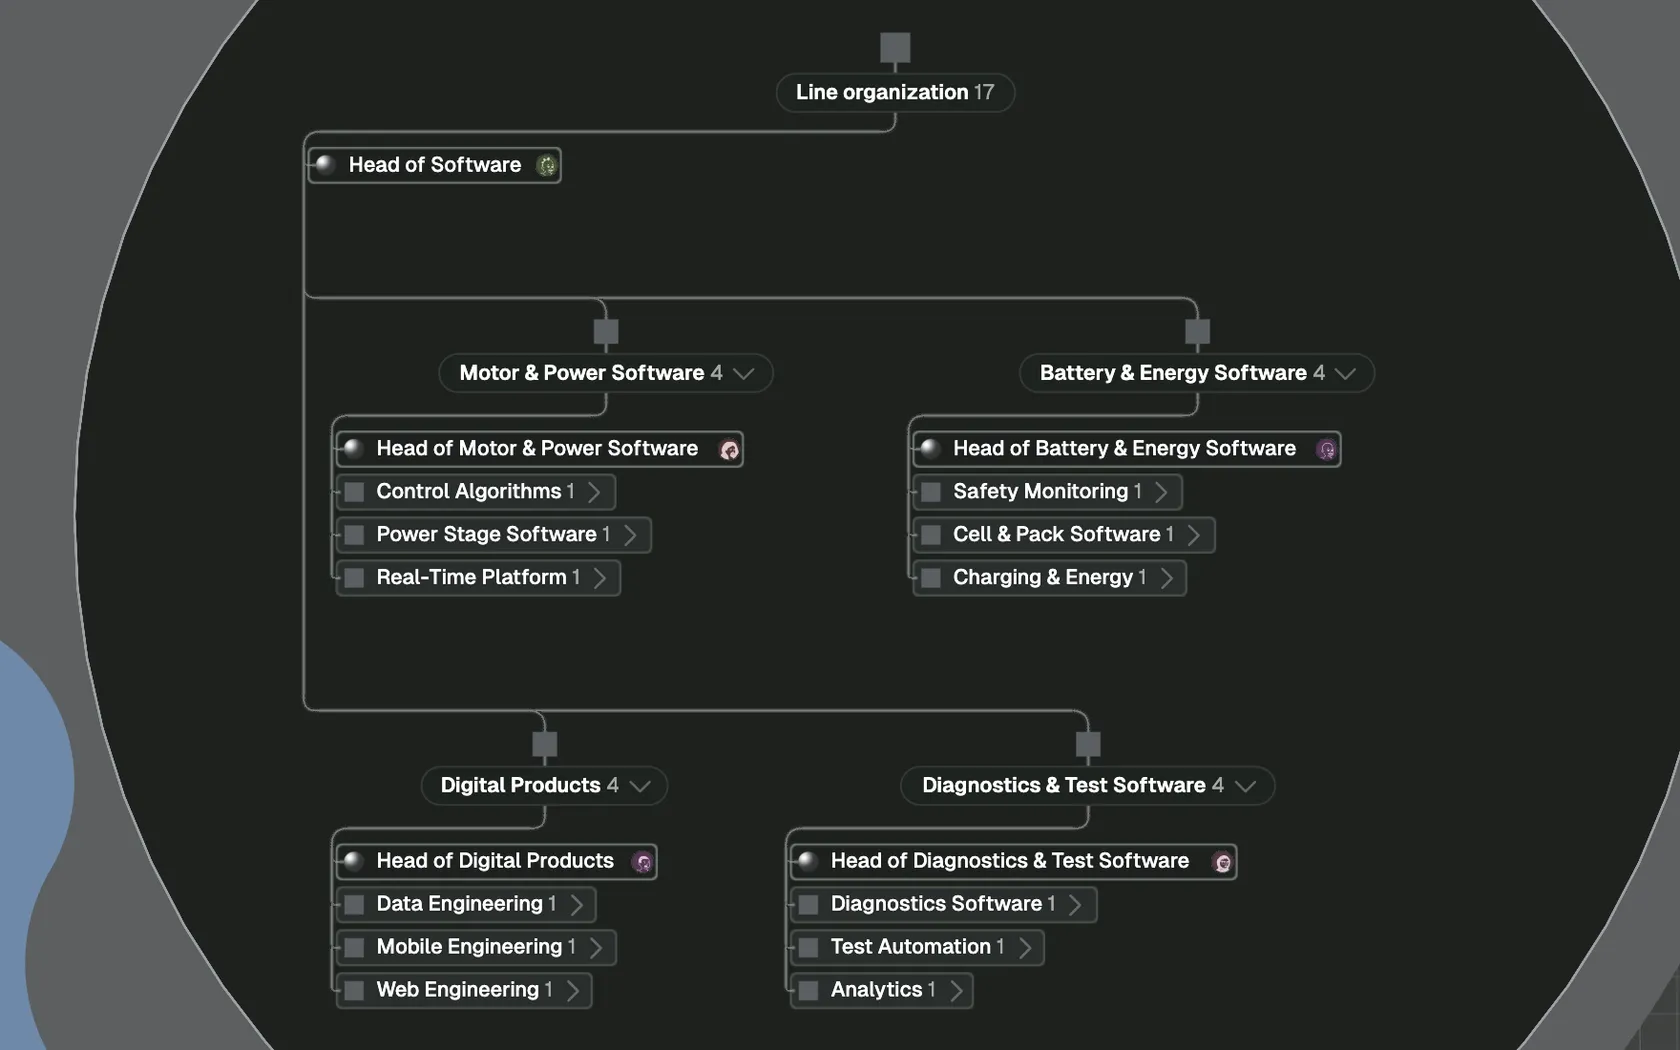
The line organization. The ART sits on the map as clearly as any department. The reporting lines sit right beside it, as the org chart everyone recognizes: Corinne Aebi as Head of Software, four department heads, twelve group leads. They are the same people as in the trains. Roland Kuster is a Business Owner of Motor Control and Head of Motor & Power Software, with one profile for both.
Shared Services, System Team and LACE. Functional Safety, UX, Cybersecurity and the Hardware Integration Lab are groups of their own, so everyone can find their roles and people. Three engineers from three teams spend a fifth of their time as Safety Engineers, and their profiles show both roles. The three Release Train Engineers and a Team Coach also hold roles in the LACE.
People in more than one team. One Scrum Master coaches two teams. A UX Designer splits her time between Customer Portal and UX. A person holds as many roles as the work needs, in any train or team. The Contribution app records each person’s share of time across those roles.
The supplier. Stellmark Power Electronics delivers the inverter hardware. It sits on the map as an external group, with its account manager, application engineer and quality contact, and with a dependency to Gate Driver Interface, the team it works with.
Dependencies that stay visible. At PI Planning, the ART Planning Board shows who depends on whom. In Peerdom, those dependencies stay after the event: a “Depends on” relationship links teams across trains, from Diagnostics to Battery, and from Condition Monitoring to the Fleet Data Platform in Digital. Relationship lines show them on the map.
Follow the value stream
SAFe builds its trains around value streams: the steps that turn a need into value for a customer. Dependencies show who relies on whom. A value stream shows the order in which the work moves, and who does each step.
In the Flows app, Valdora describes one value stream as a flow in seven steps: “From field alert to fixed fleet”. The Fleet Data Platform in Digital spots an anomaly in vehicle data. Condition Monitoring triages the alert, On-board Diagnostics builds the fix, the System Team integrates and tests it, and Functional Safety approves it. The fix ships with the Diagnostics train, and Customer Portal tells fleet operators what changed. Each step names the roles involved, with the people who hold them.
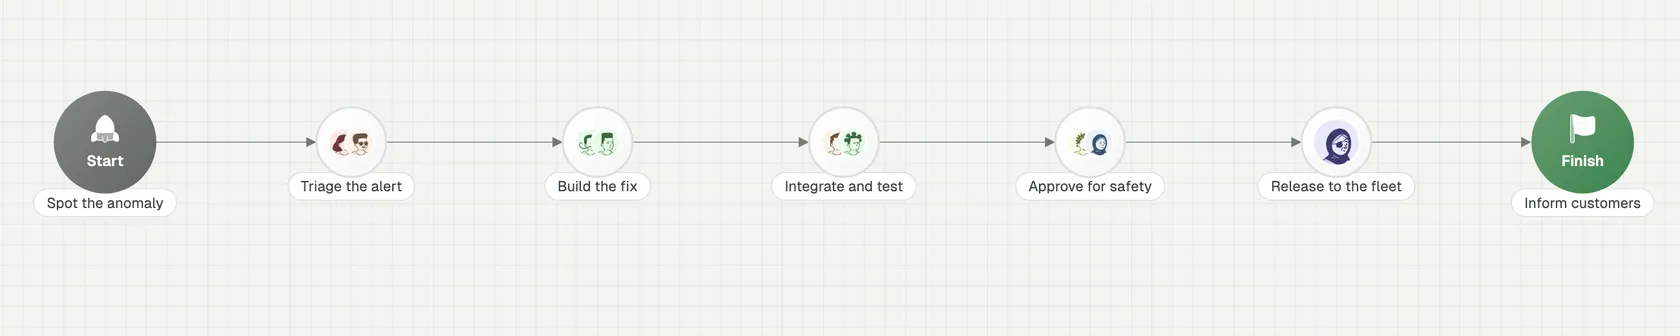
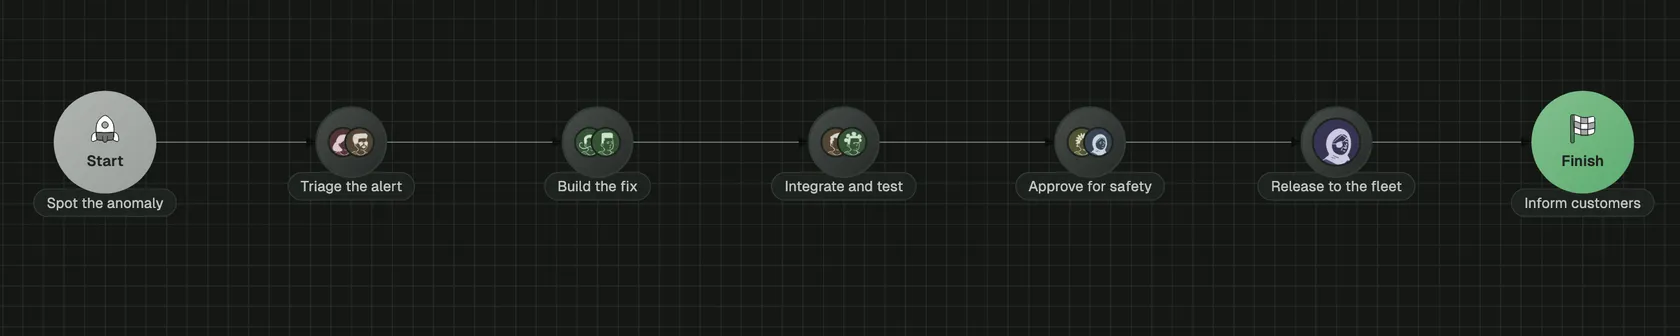
Choose Show on map, and the flow is drawn over the roles involved. The value stream starts in Digital, runs through the Diagnostics train, the System Team and Functional Safety, and ends in Digital again: one line of work across both halves of the merger.
Same data, a different picture: Orbit
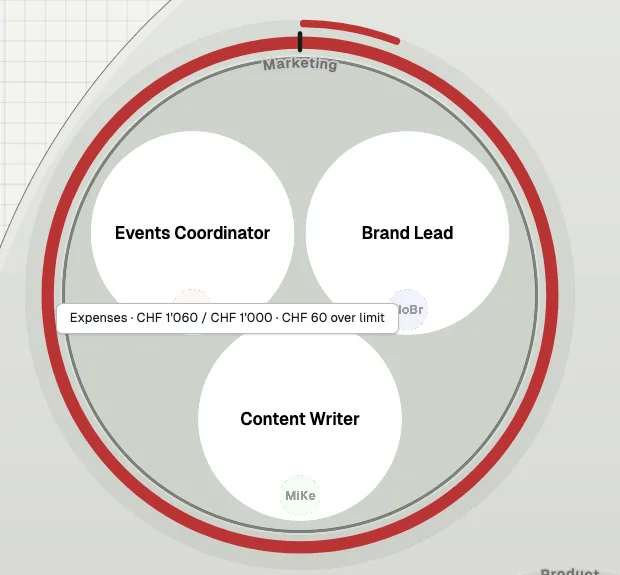
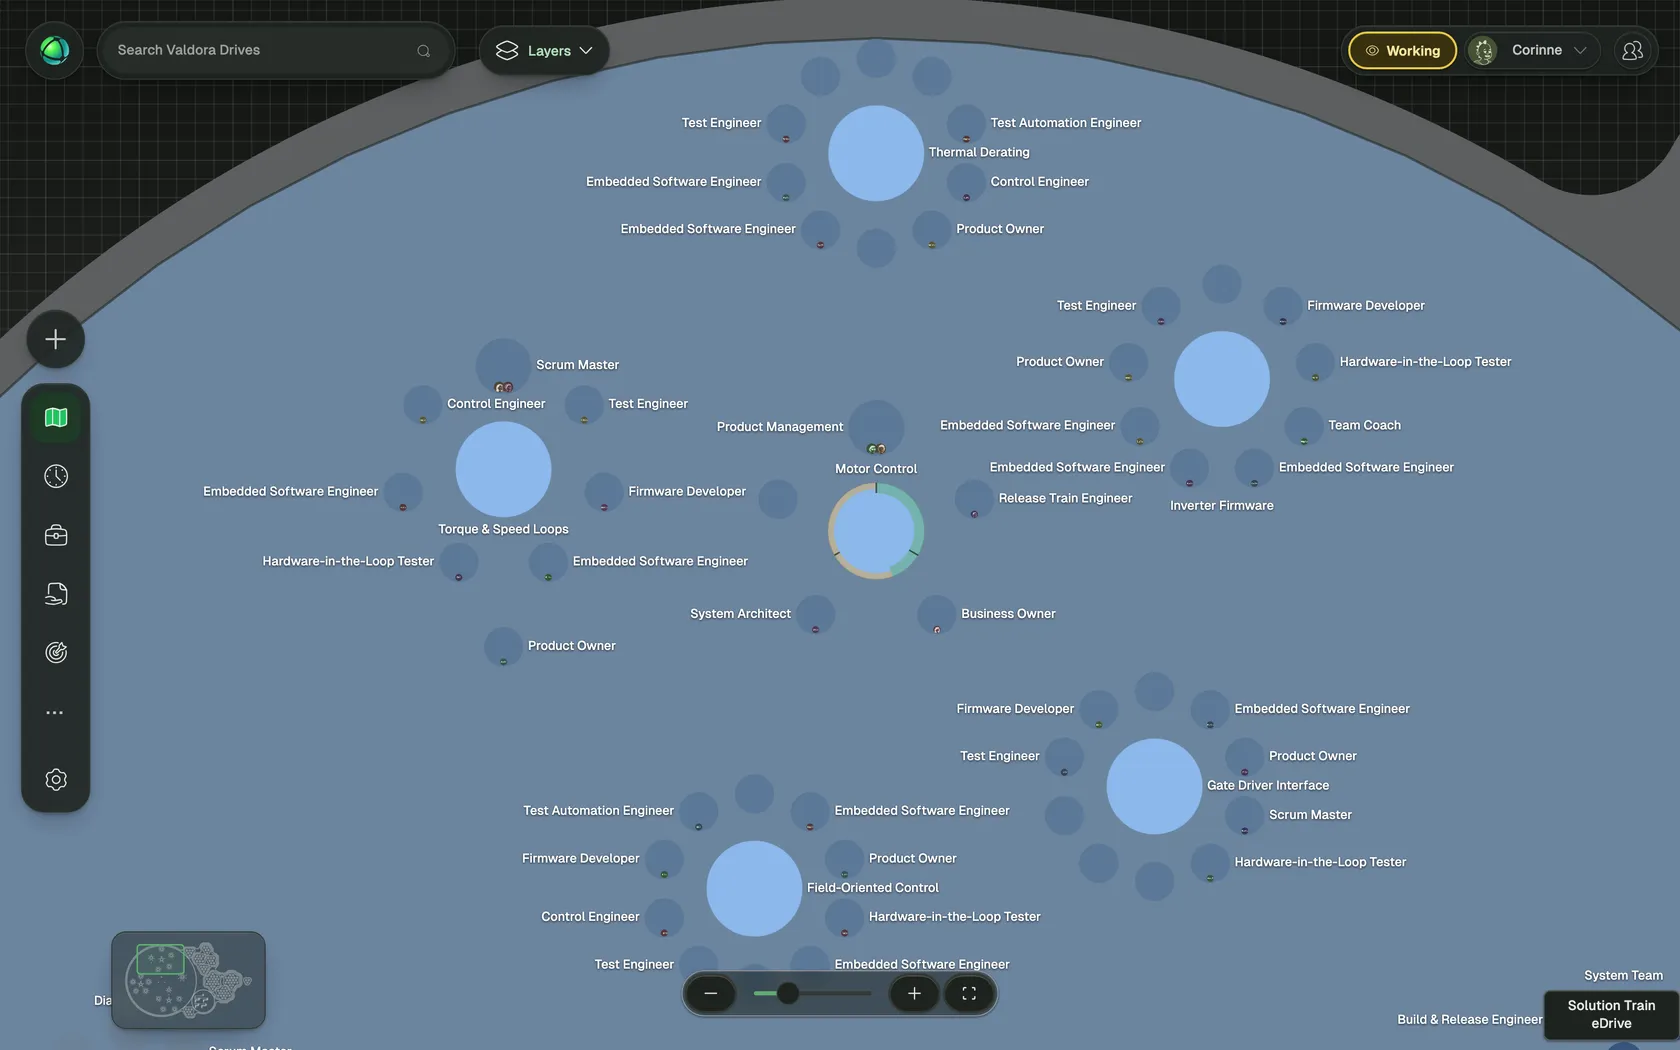
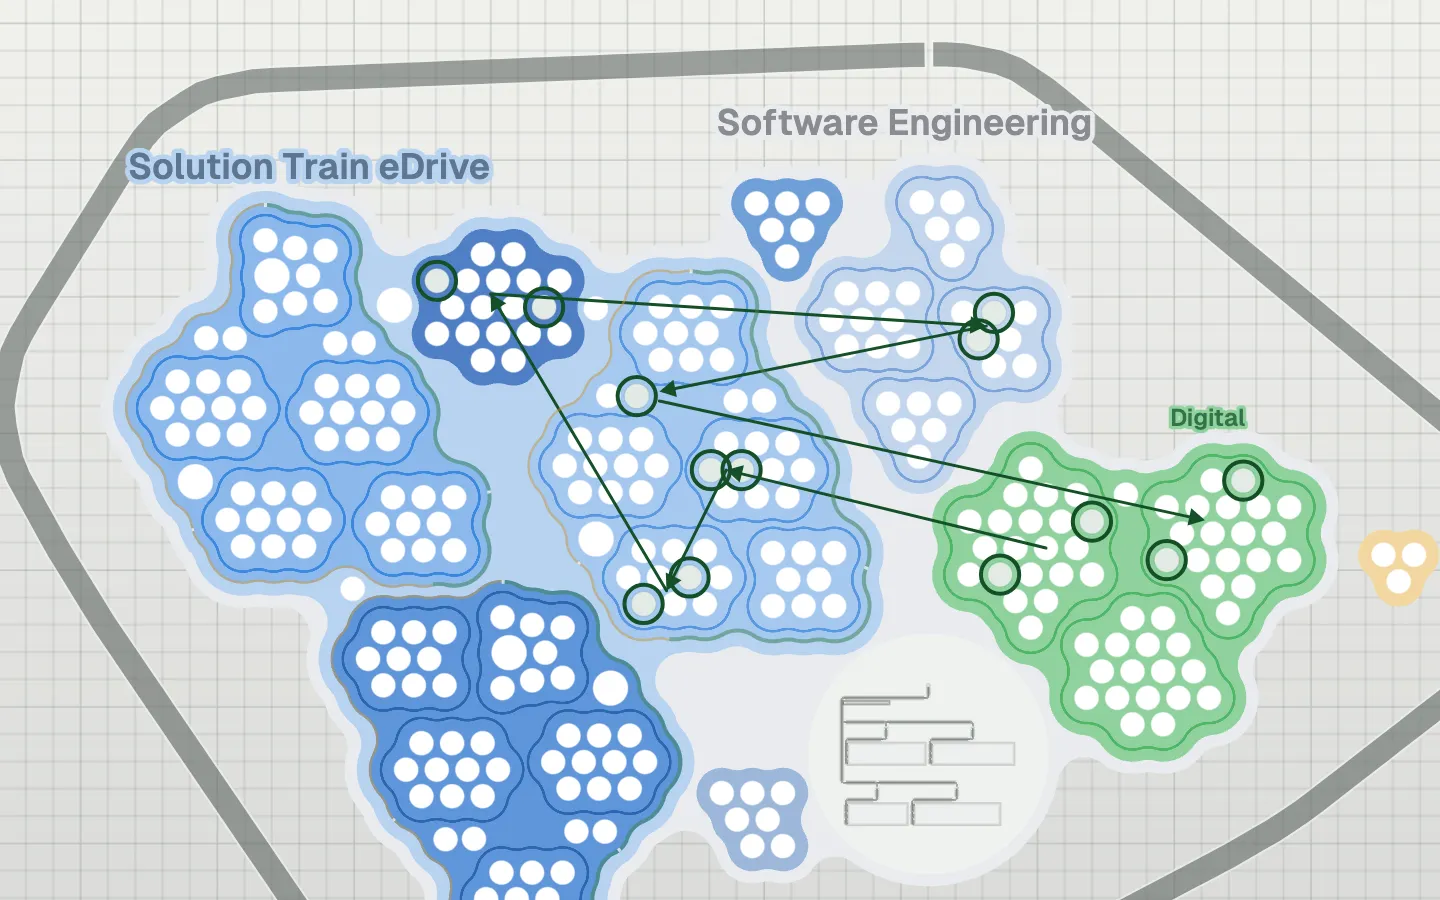
Give the Solution Train its own layout and see the same department from another angle. Open the group’s Design tab and choose Orbit: roles orbit each group in a ring, while the rest of the map stays in Bubble. The line organization keeps its Org Chart layout.
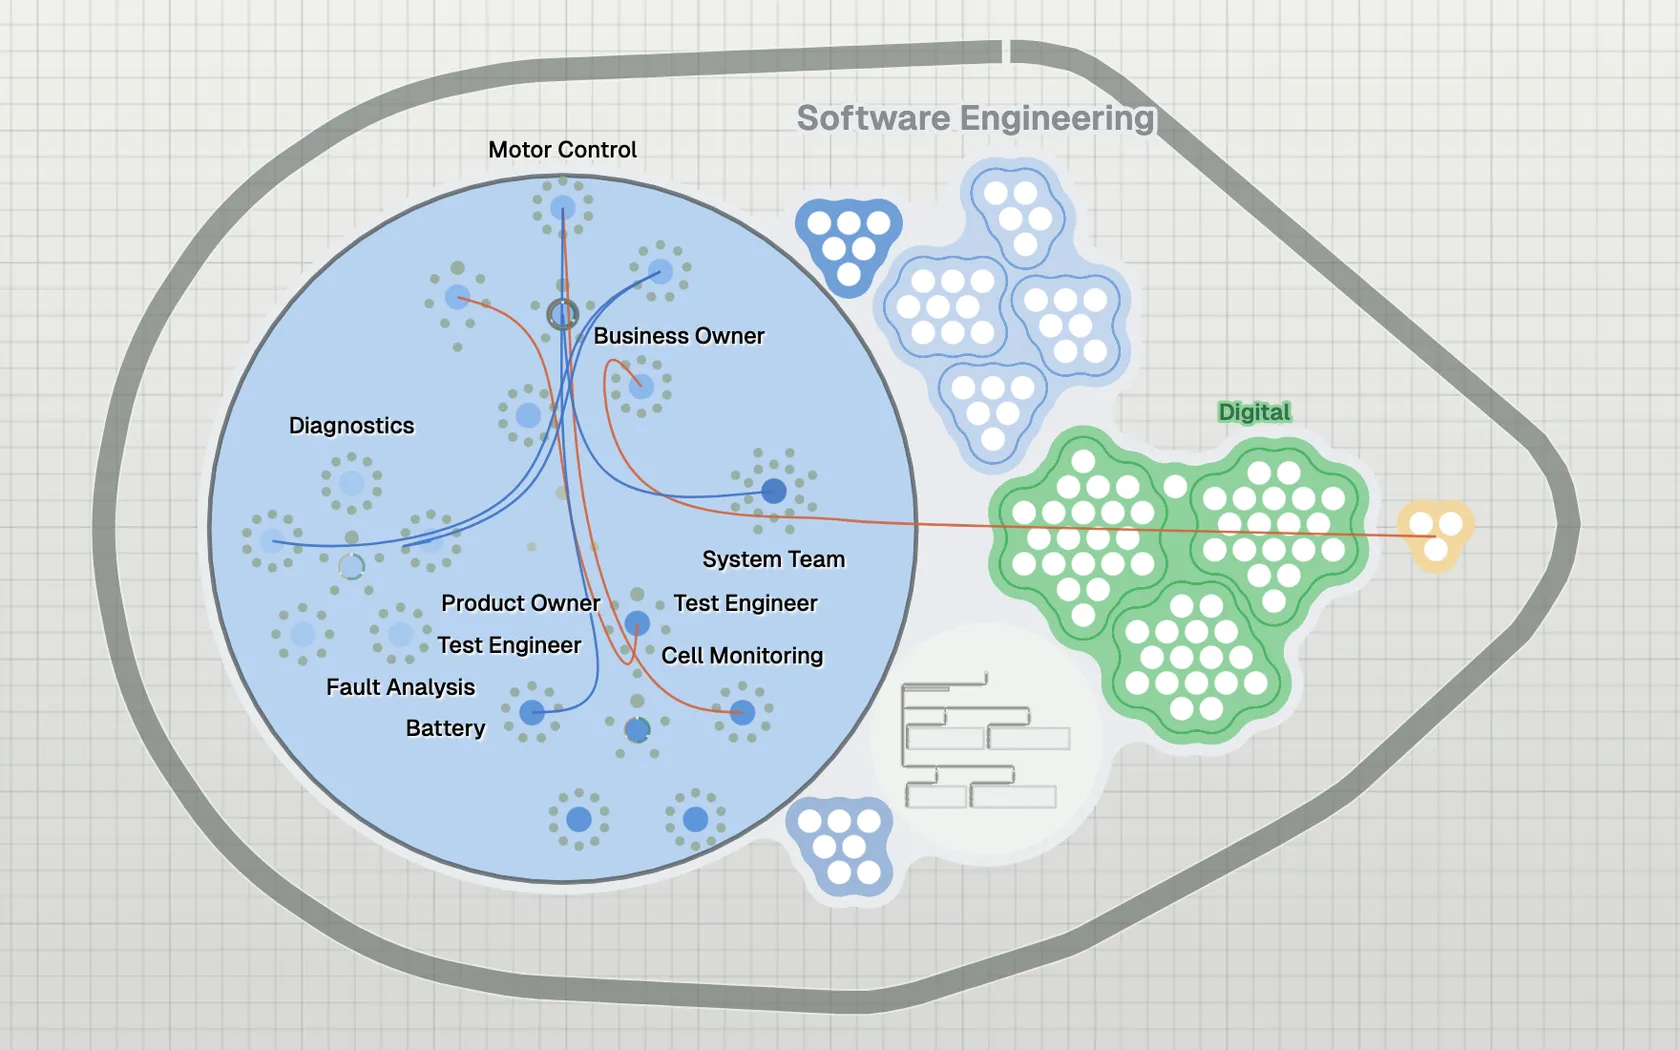
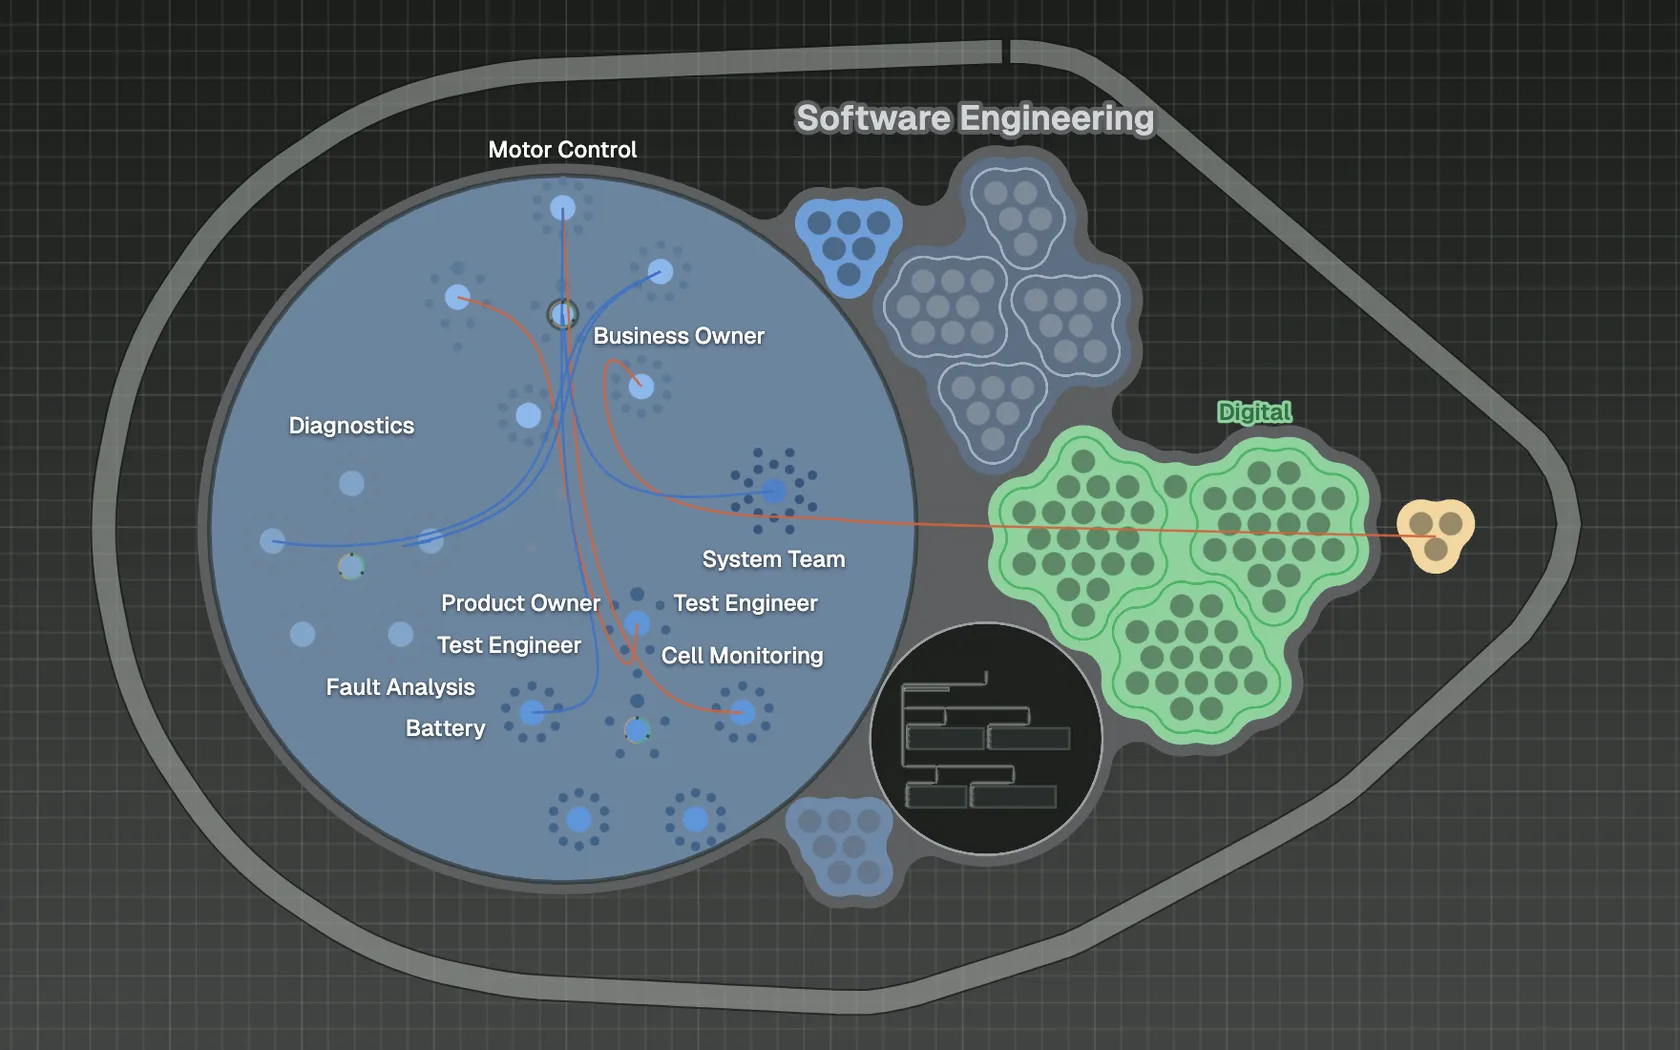
Select a team to see its dependency lines. Changing the layout of a group changes the view while preserving your groups, roles, people and relationships, and you can switch back at any time.
Where do I belong?
Now the view from inside. Hannah Wenger is a Data Engineer in the team Condition Monitoring, in the ART Diagnostics. The map answers the questions a new framework raises:
- My team: Condition Monitoring, with Product Owner Mehmet Ferrari and Scrum Master Julia Fischer.
- My train: Diagnostics, with Release Train Engineer Fabienne Arnold.
- My line role: Group Lead of Analytics in Diagnostics & Test Software, headed by Veronika Hess, who is also a Business Owner of her train.
- What we depend on: On-board Diagnostics and the Fleet Data Platform.
- What I work on across the department: the project “Predictive maintenance”.
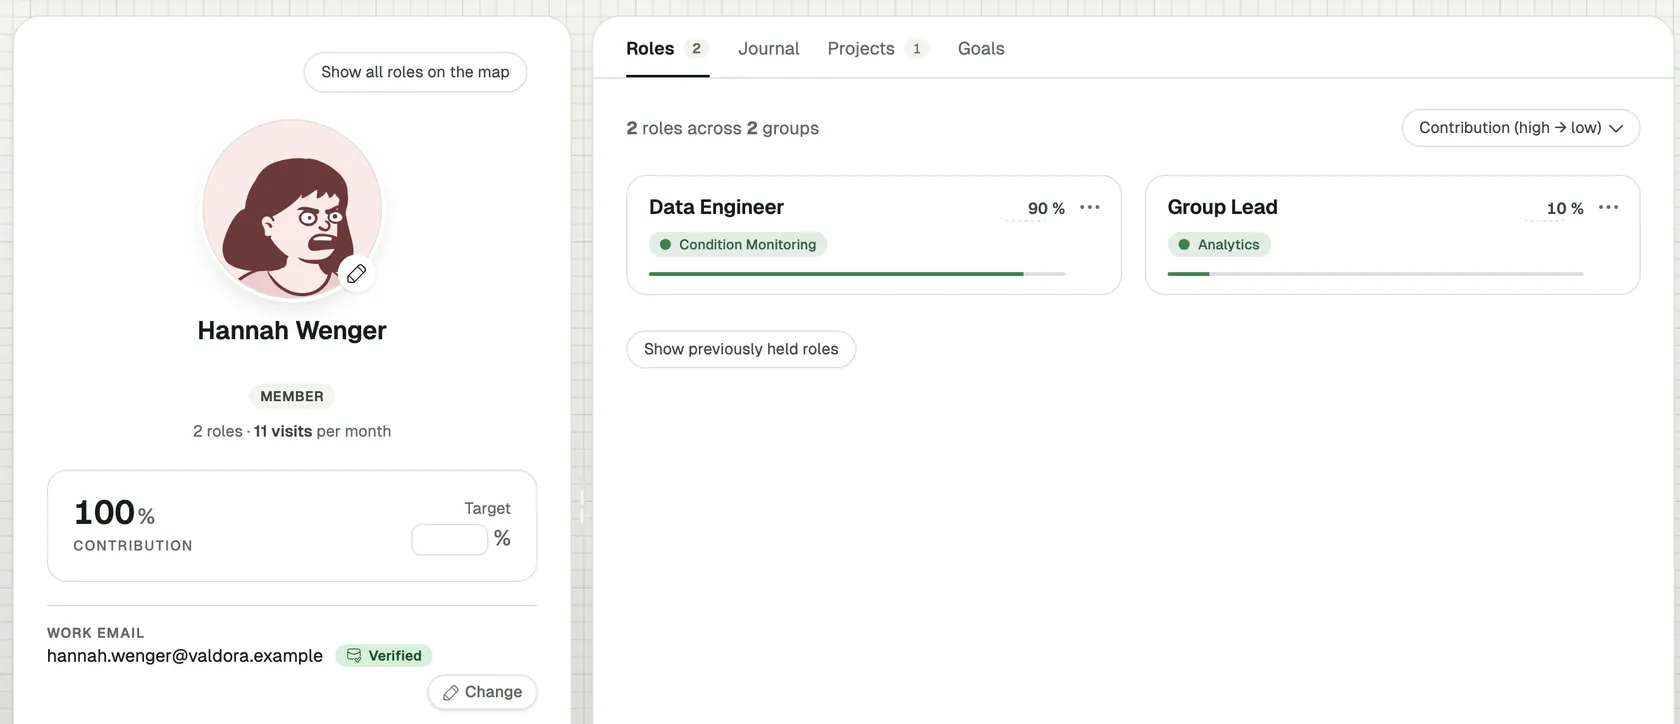
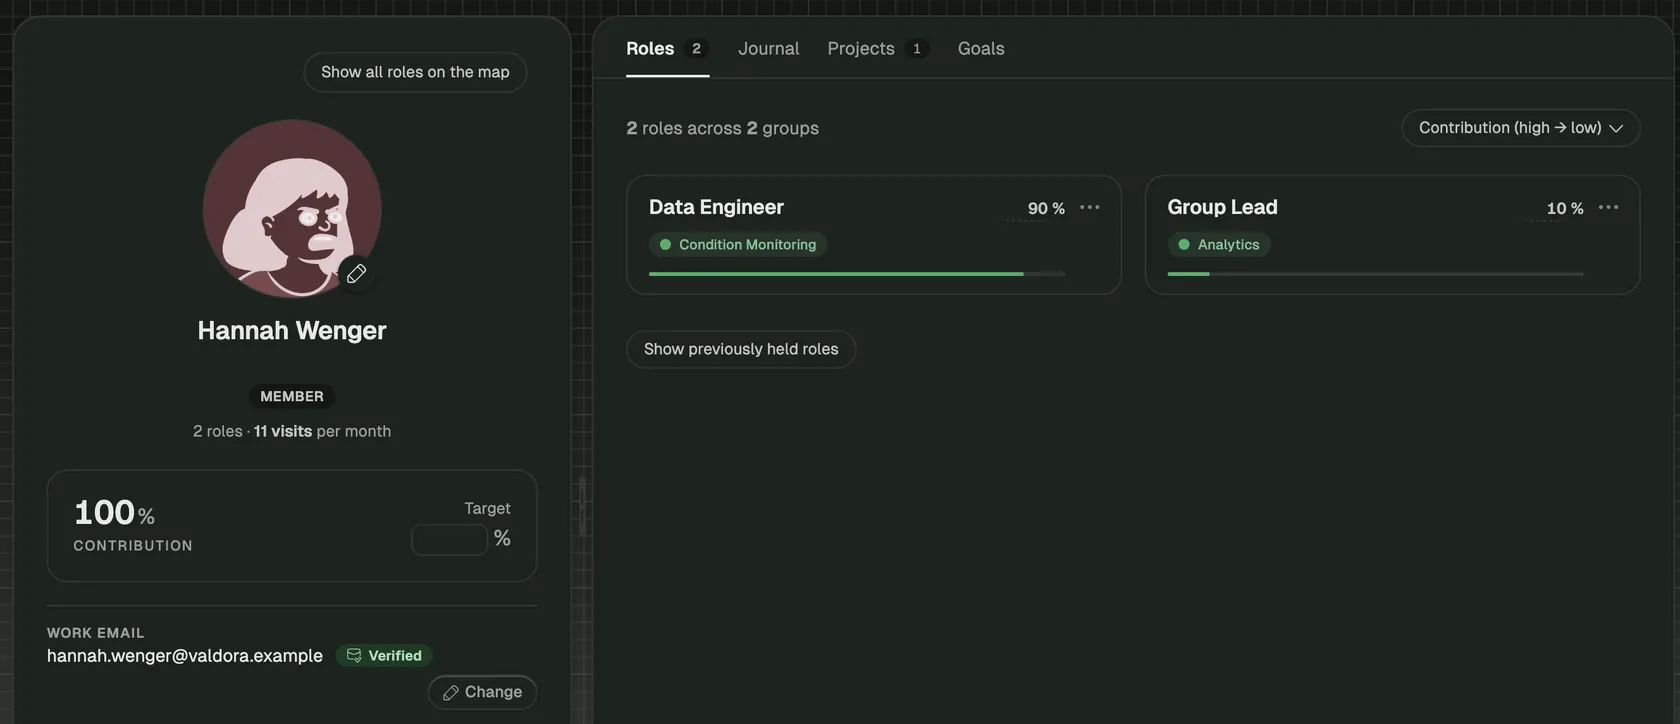
Hover over a colleague in the map’s people list, or select them there, to highlight every role they hold, in the trains and in the org chart.
The epic that crosses both halves is a project in the Projects app. “Predictive maintenance” brings together eleven roles from four Diagnostics teams and the Fleet Data Platform. It runs on one outline around the map, and selecting it draws a line to every role on it.
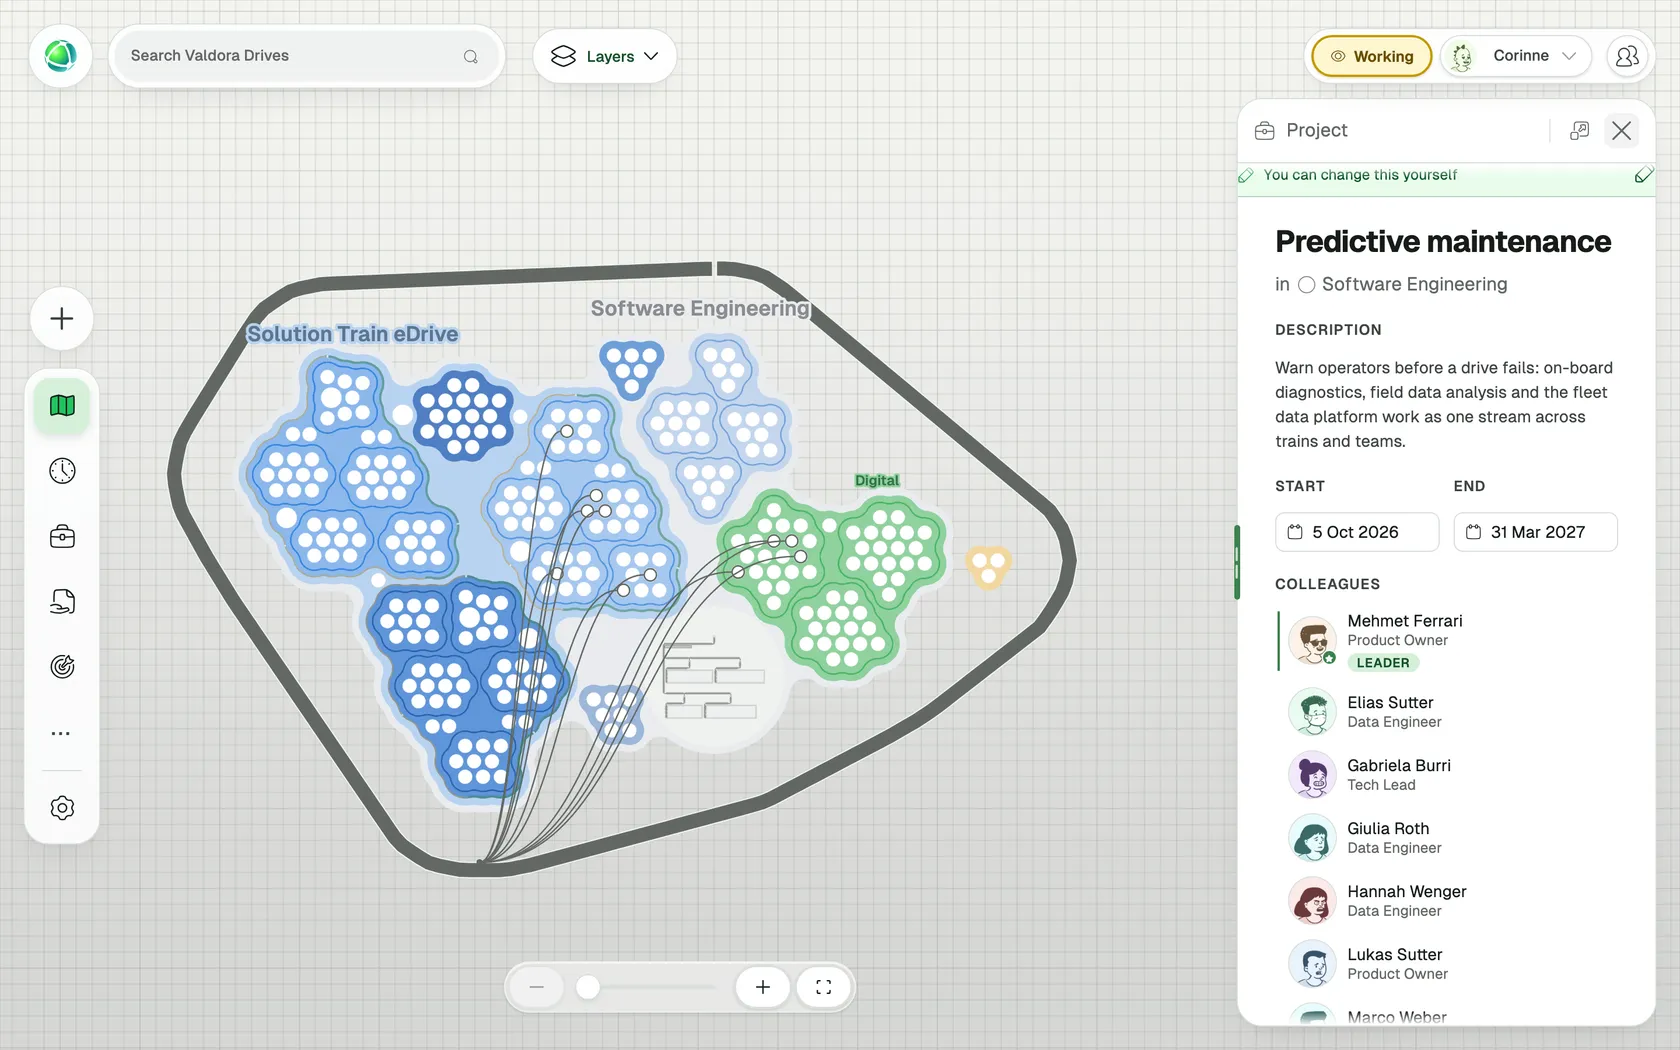
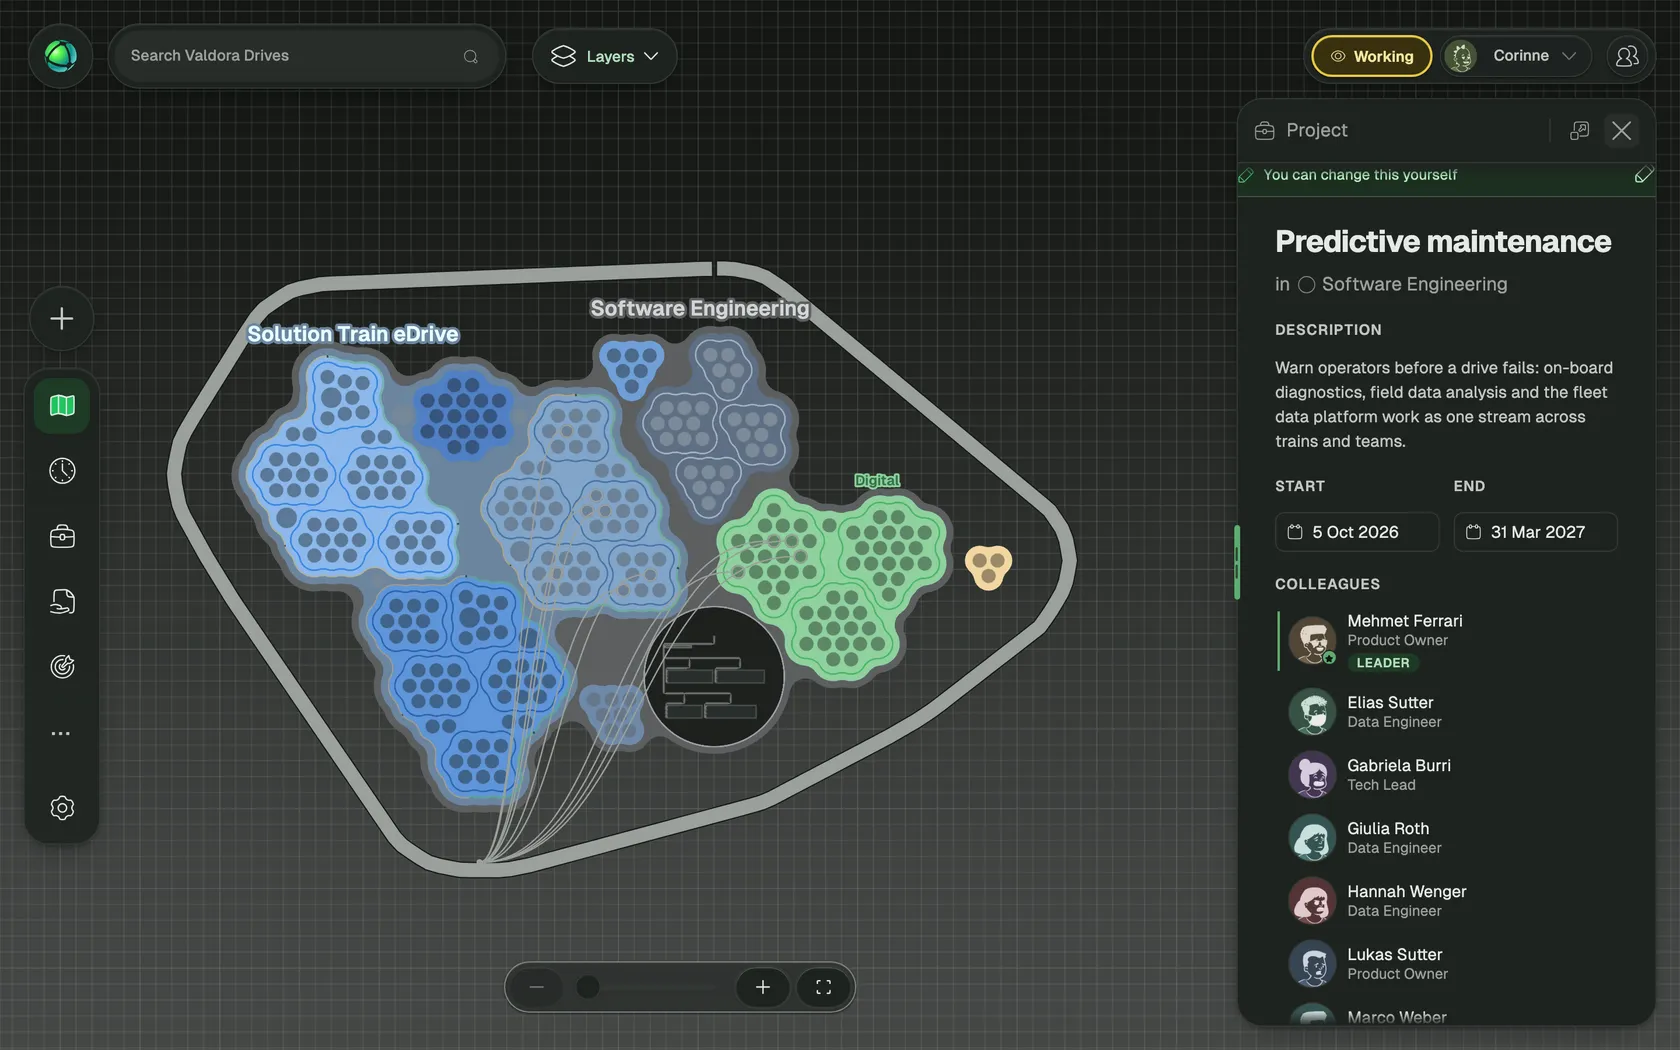
The PI Objectives of each ART live in the Goals app, attached to the train they belong to.
What research says
We want to be open about this: Peerdom is framework-agnostic. SAFe, LeSS, product teams or your own model all fit on the map. Research gives good reasons for that stance.
- The hard part is the organization around the teams. A systematic review of 42 large-scale agile transformations found integrating non-development functions as a challenge in 43 % of cases, hierarchical management and organizational boundaries in 33 %, coordination across many teams in 31 %, and using old and new approaches side by side in 12 % (Dikert, Paasivaara & Lassenius, 2016).
- Coordination takes many forms. A study of a large-scale agile program identified 27 inter-team coordination mechanisms (Berntzen, Hoda, Moe & Stray, 2023).
- Agile parts live inside plan-driven wholes. Research in automotive describes agile islands in a waterfall environment (Kasauli et al., 2020).
- Frameworks meet existing structures. Across 13 transformation cases over 15 years, balancing the organizational structure with a large-scale framework stood out as one of nine key challenges (Conboy & Carroll, 2019).
- The framework matters less than people think. A survey of 15,078 members of 4,013 agile teams compared SAFe, LeSS, Scrum of Scrums, custom approaches and teams without a scaling approach. The differences in team effectiveness were too small to matter in practice (Verwijs & Russo, 2024).
In Dikert’s review, almost 90 % of the papers were experience reports. A SAFe-specific review likewise drew mainly on gray literature (Putta, Paasivaara & Lassenius, 2018). Structural boundaries and coordination recur throughout these studies, and those are exactly the things a shared map makes visible.
Choose the framework that fits your people, and make it visible to all of them. A train, a team, a reporting line and a dependency are facts about how your organization works. When everyone sees them on one map, the framework becomes something people can find their way in.
 Bastiaan van RoodenCEOPeerdom
How to set it up
As an Owner, switch to Editing, then:
- Model your portfolio, Solution Train, ARTs, teams and Shared Services as groups, with the SAFe roles inside them.
- Add people to every role they hold. One person keeps one profile across trains, teams and the line organization.
- Add your line organization as a group, open its Design tab and choose Org Chart.
- Add external suppliers as external groups beside your organization.
- In Settings, create a relationship field such as “Depends on” for groups (Peerdom+), and link the teams. To see the links as lines on the map, turn on Show relationships on the map under Settings > Map, and the Relationships layer.
- Record each person’s share of time in the Contribution app.
- Create epics as projects in the Projects app, and attach PI Objectives to each train in the Goals app.
- Describe each value stream as a flow in the Flows app: add its steps, involve the roles in each step, set its access to Public, and choose Show on map.
- In the Design tab of the Solution Train group, under Layout, choose Choose a layout for Solution Train eDrive, then Orbit, to see the same data in a different view.
Step-by-step guides are in the documentation: Group layouts, Relationships, Flows and Bubble Map.
Groups, roles, group layouts and every map layout are included in every plan. The free Peerdom plan supports up to 10 people. Relationship fields come with Peerdom+. The Contribution, Projects, Goals and Flows apps are add-ons for Peerdom+, and you can try them first. Peerdom is a Swiss company: with our Swiss Safe Harbour approach, your map is hosted in Zürich, Switzerland, which matters when it holds your reporting lines. Our data processing agreement describes where data is processed and lists our current sub-processors.
Common questions
Can one person work in several teams or trains? Yes. A person holds roles in as many groups as the work needs and keeps one profile. The Contribution app records the share of time for each role.
Can we keep our line organization next to the trains? Yes. Draw it as an Org Chart on the same map. The same people appear in both, so everyone sees their train and their reporting line together.
Does Peerdom use the SAFe terms? It uses yours. Groups and roles carry the names you give them: Release Train Engineer, Business Owner, Scrum Master or Team Coach. Teams that work differently keep their own terms on the same map.
Can we show dependencies between teams after PI Planning? Yes. A relationship field such as “Depends on” links teams across trains and to suppliers, in each team’s details. Turn on relationship lines to show those links on the map.
Can we map our value streams? Yes. Describe each value stream as a flow in the Flows app, with the roles involved in each step, and show it on the map over your trains and teams.
Does it work for a department of several thousand people? Yes. We tested Peerdom with a fictional company of 10,000 people; read Does Peerdom scale?.
Is Peerdom a SAFe tool? Peerdom is framework-agnostic. It maps how your organization is built, whichever framework you use, and your backlog tool keeps tracking features and stories.
Valdora Drives and Stellmark Power Electronics are fictional demo companies used to illustrate this article. Every name in the screenshots is fictional.
SAFe and Scaled Agile Framework are registered trademarks of Scaled Agile, Inc.