“We want to see how we actually work, but we’re also keeping the org chart we’ve had for years.”
Over the past eight years, we have heard some version of that sentence again and again. Many organizations think about how they allocate work through a classical org chart. It is the picture they have always used, yet it captures only part of their daily work.
They are onto something: every organization with a reporting line has a second organization running through it. It is made of the projects, working groups and mission teams where much of the real work happens. Most people belong to both: a home team with a manager, and one or more fluid, networked teams. Now you can see both, on one map.
The organization on your org chart
Everyone is familiar with boxes and lines, a boss for each person, and a clear career path from the newest hire to the CEO.
The org chart carries a lot of weight. Salaries, HR rights, compliance, access to information, and career paths are all tied to it. It tells you where you were hired and where you might go next. It also provides a shared language across organizations. If you move to another company, you can still work out roughly where you belong in terms of management levels.
For more than a century, the org chart has been the standard way to describe an organization, and many companies grew their success on it. That is why so few of them want to take it apart.
The organization you work in every day
Now think about the work people actually did last week.
Take a Senior Data Analyst in the Finance team. On the org chart, that is one box and one boss. This quarter, the same person is also building the reporting for a new plant, working with Legal and IT on a customer data migration, and mentoring two junior colleagues in Sales.
All of that happens in teams and ephemeral projects that sit outside the boxes and lines. People come together around a project, hold a role in it, get it done and take on the next one.
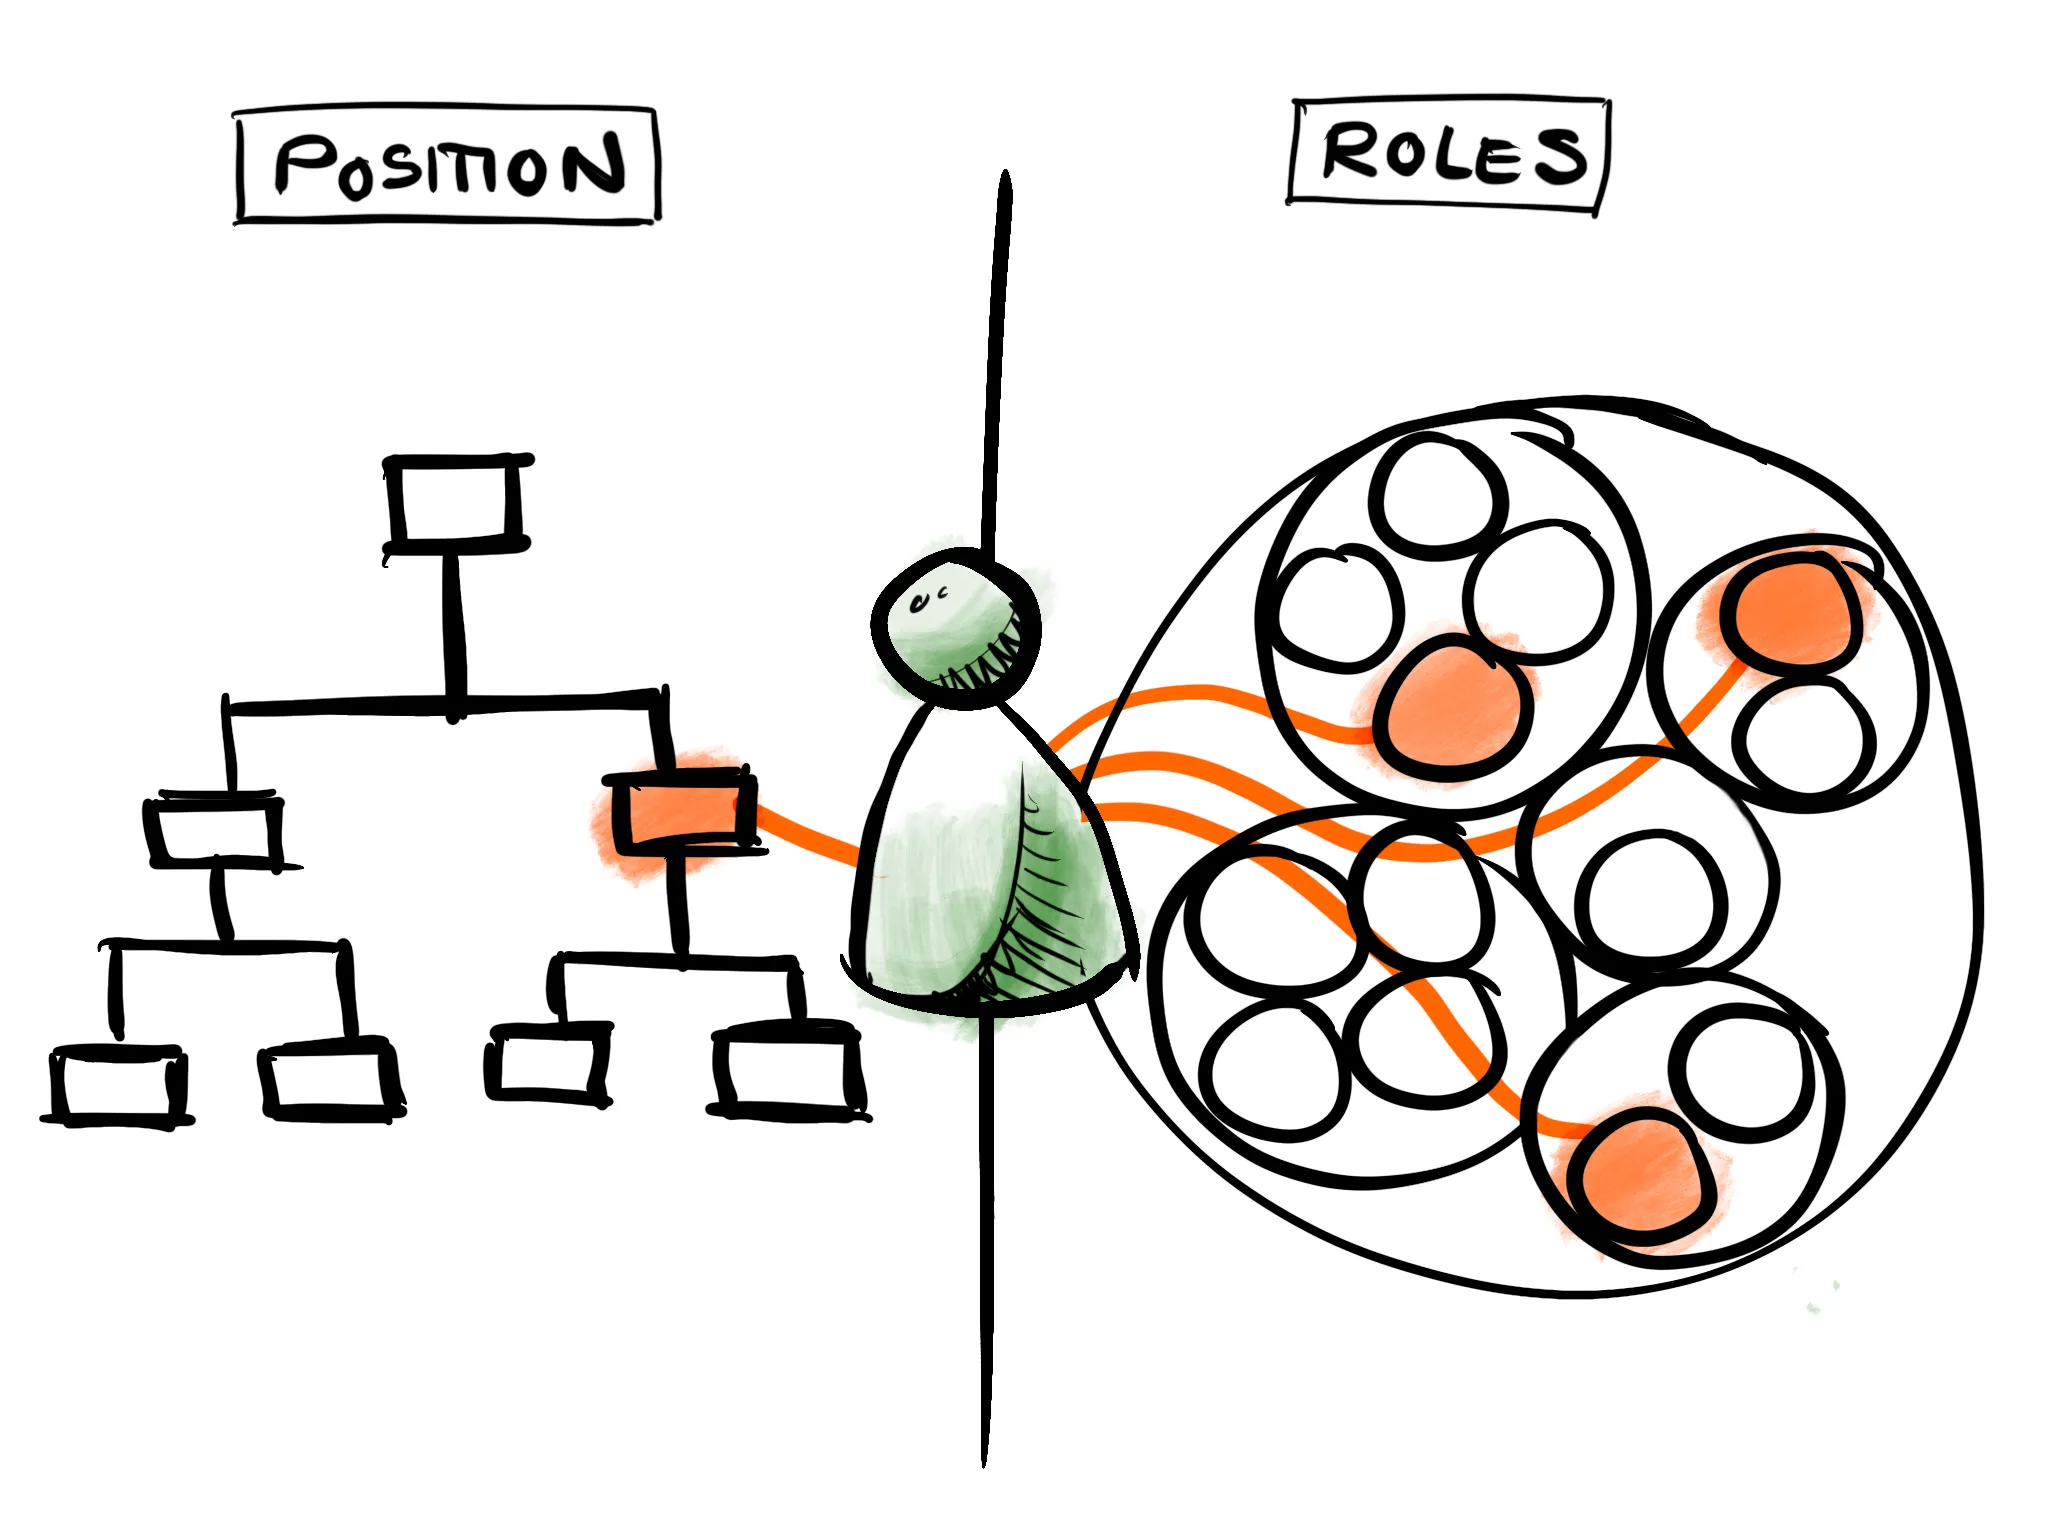
Both descriptions are true. The org chart says where you belong. The work says what you are doing and who you are doing it with. One changes when someone is hired or promoted, the other every few weeks.
Two pictures, and each answers half the questions
Most companies keep these two organizations alive at the same time. The reporting lines live in the HR system. The work lives in project lists and spreadsheets, in chat channels, and in people’s heads. When someone needs the whole story, they draw it on a whiteboard or a PowerPoint slide.
Each picture on its own raises questions. If you only show people the org chart, they can’t find out who is actually working on what. If you only show them the fluid, networked side, they rightly ask: “Where do I belong? Who has the right to decide?”
People need both answers, and they need them together.
Kotter’s dual operating system
Management literature has a name for this. In his 2012 Harvard Business Review article “Accelerate!” and his 2014 book Accelerate, John Kotter described a dual operating system: keep the hierarchy for running the business reliably, and add a network of volunteers next to it for fast, strategic change. Both run at the same time, with the same people.
What we see in practice is broader. For most organizations that come to us, the second organization goes beyond strategic initiatives: it is how ordinary work gets done. Bayer Pharma Schweiz, for example, maps Chapters as home teams for reporting lines and Nuclei for the cross-functional work, as we described in our Bayer story and our guide to Dynamic Shared Ownership. Roche runs Mission Based Teams on top of its line organization.
Many organizations run a dual operating system without ever using the name, but they rarely make the whole of it visible.
Both on one map
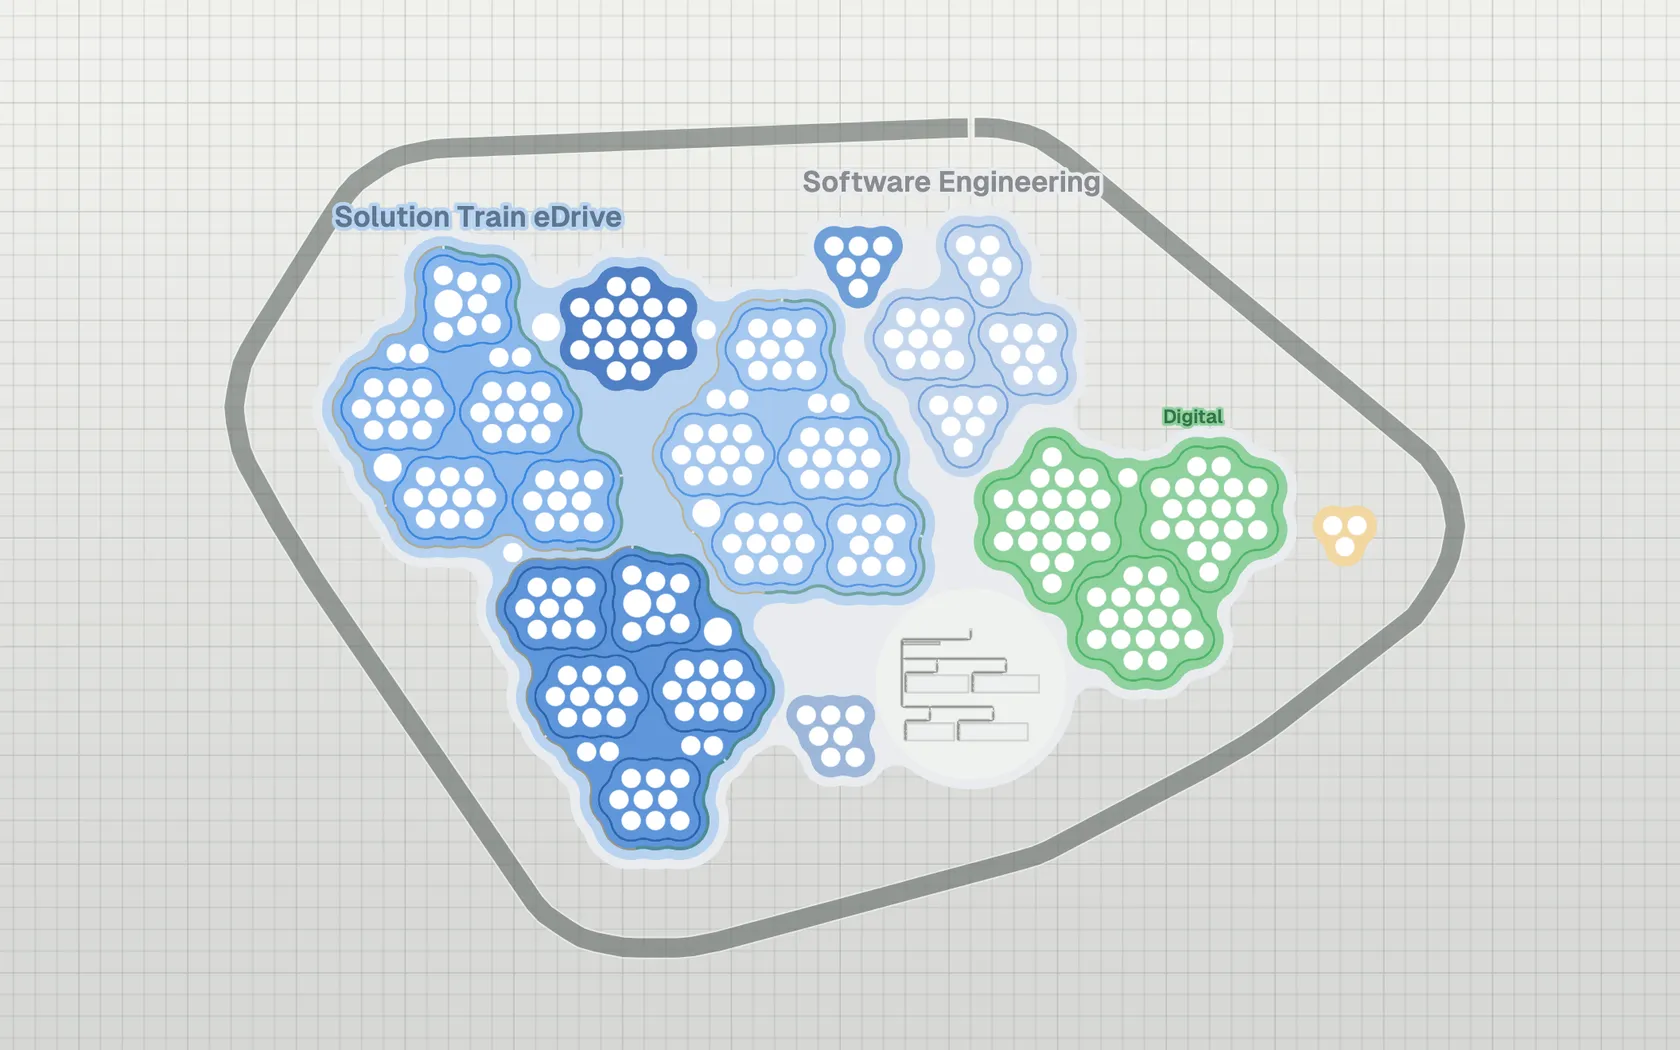
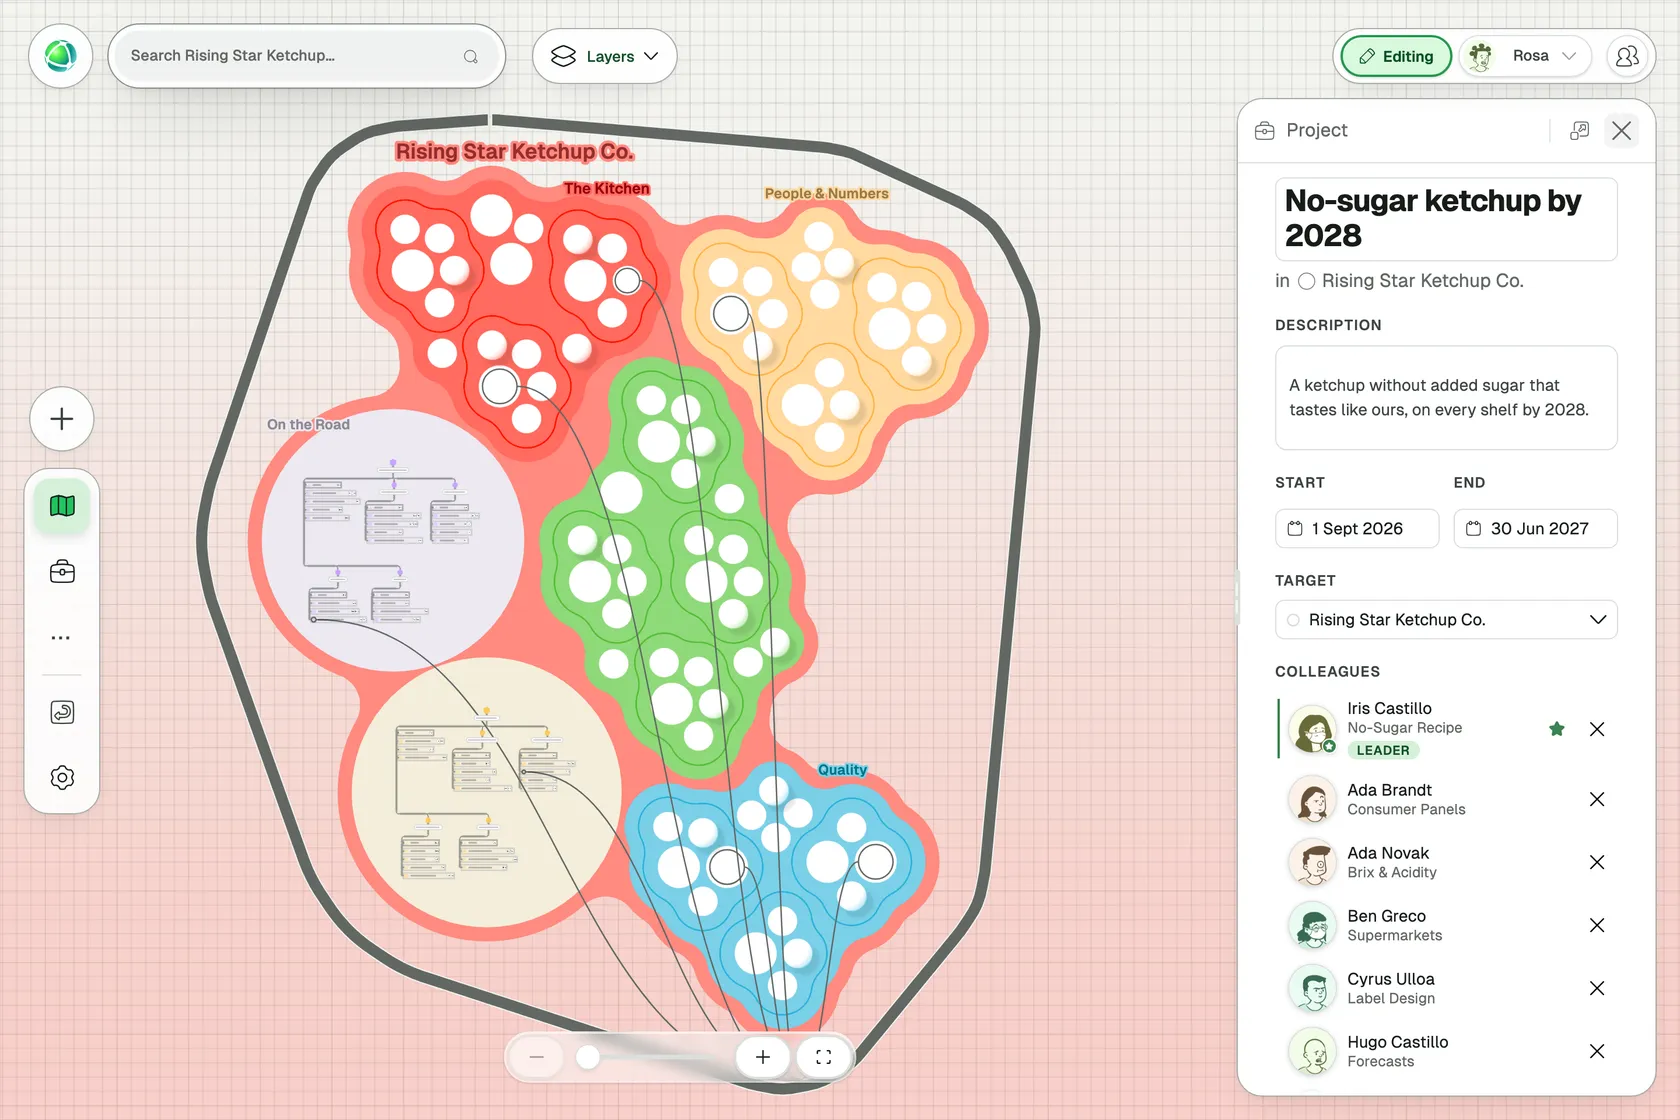
Since Peerdom 5.3, any group on your map can have its own layout. You can set one group to the Org Chart layout to show the reporting lines everyone recognizes. Alongside that org chart, your teams and missions can be drawn in bubbles or circles. Projects for the whole organization run on an outline around all of it and show the connections between the two operating models.
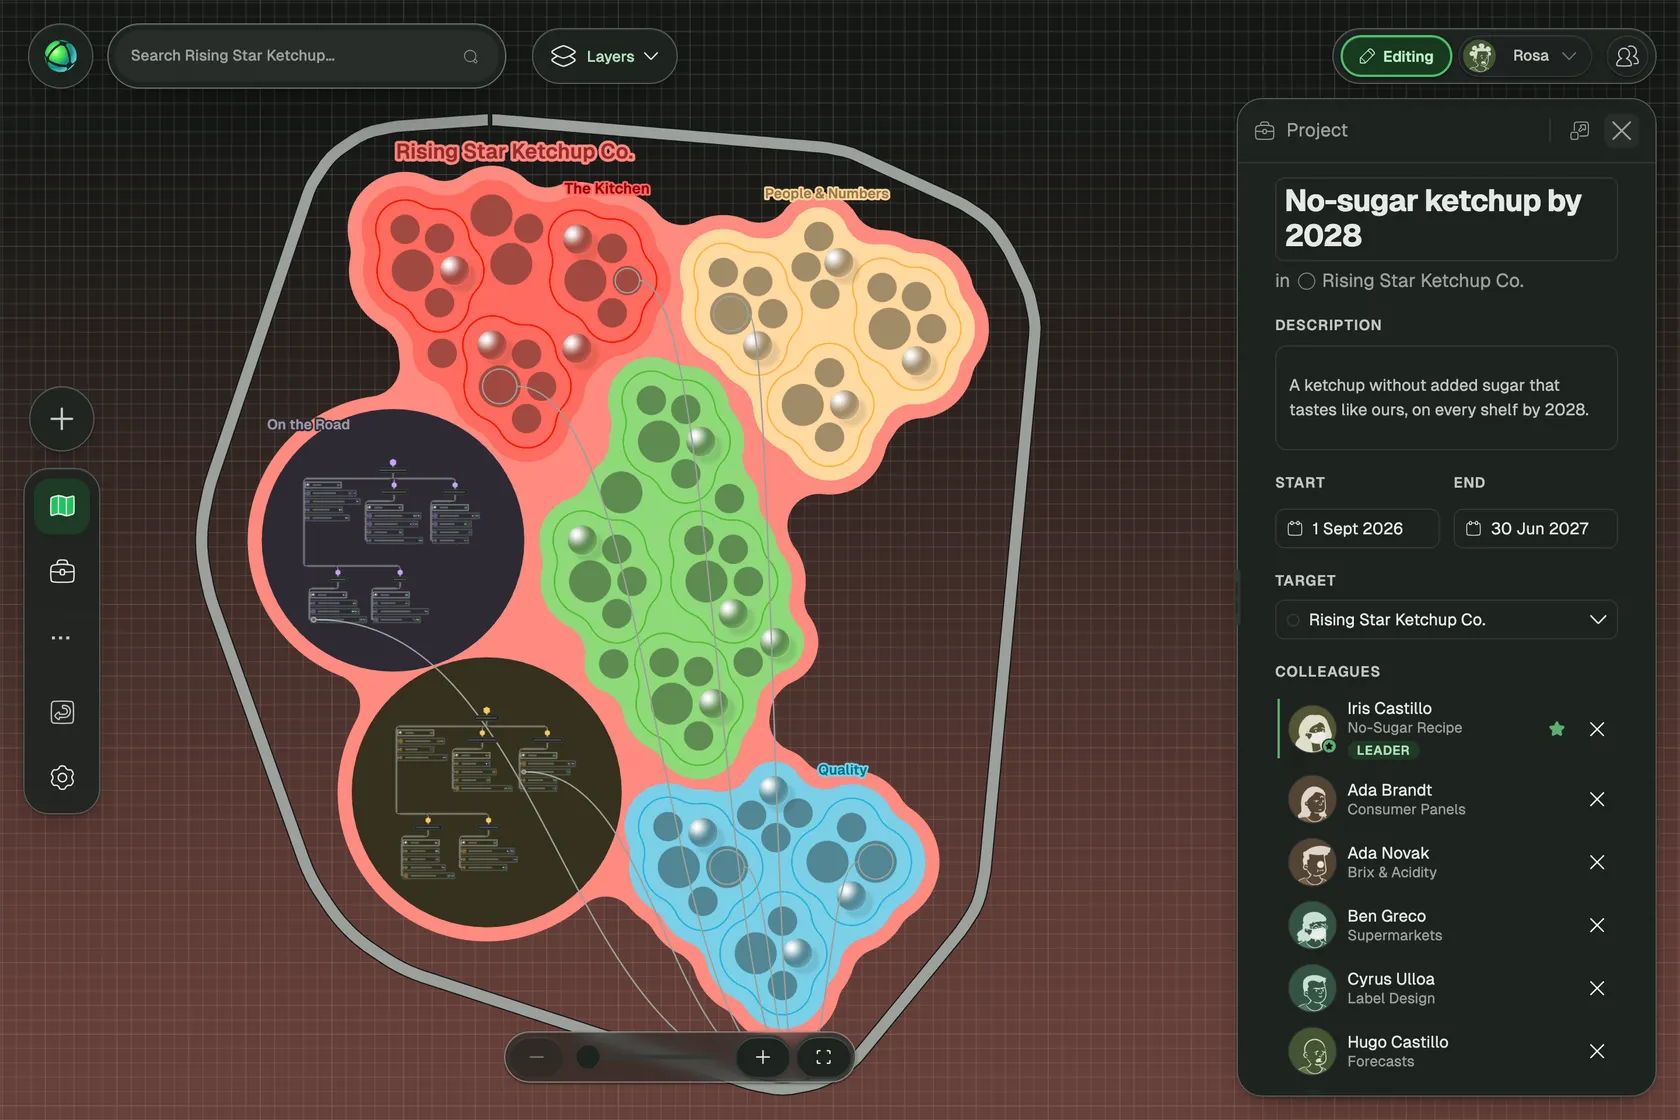
Rising Star Ketchup Co. is a fictional food company that works this way. Bottling and On the Road run in shifts with clear supervisors, so they are drawn as org charts. The company-wide project “No-sugar ketchup by 2028” brings together colleagues from across the company. Select it, and lines run to every role on the project, whether that role sits in a bubble or in a row of the org chart.
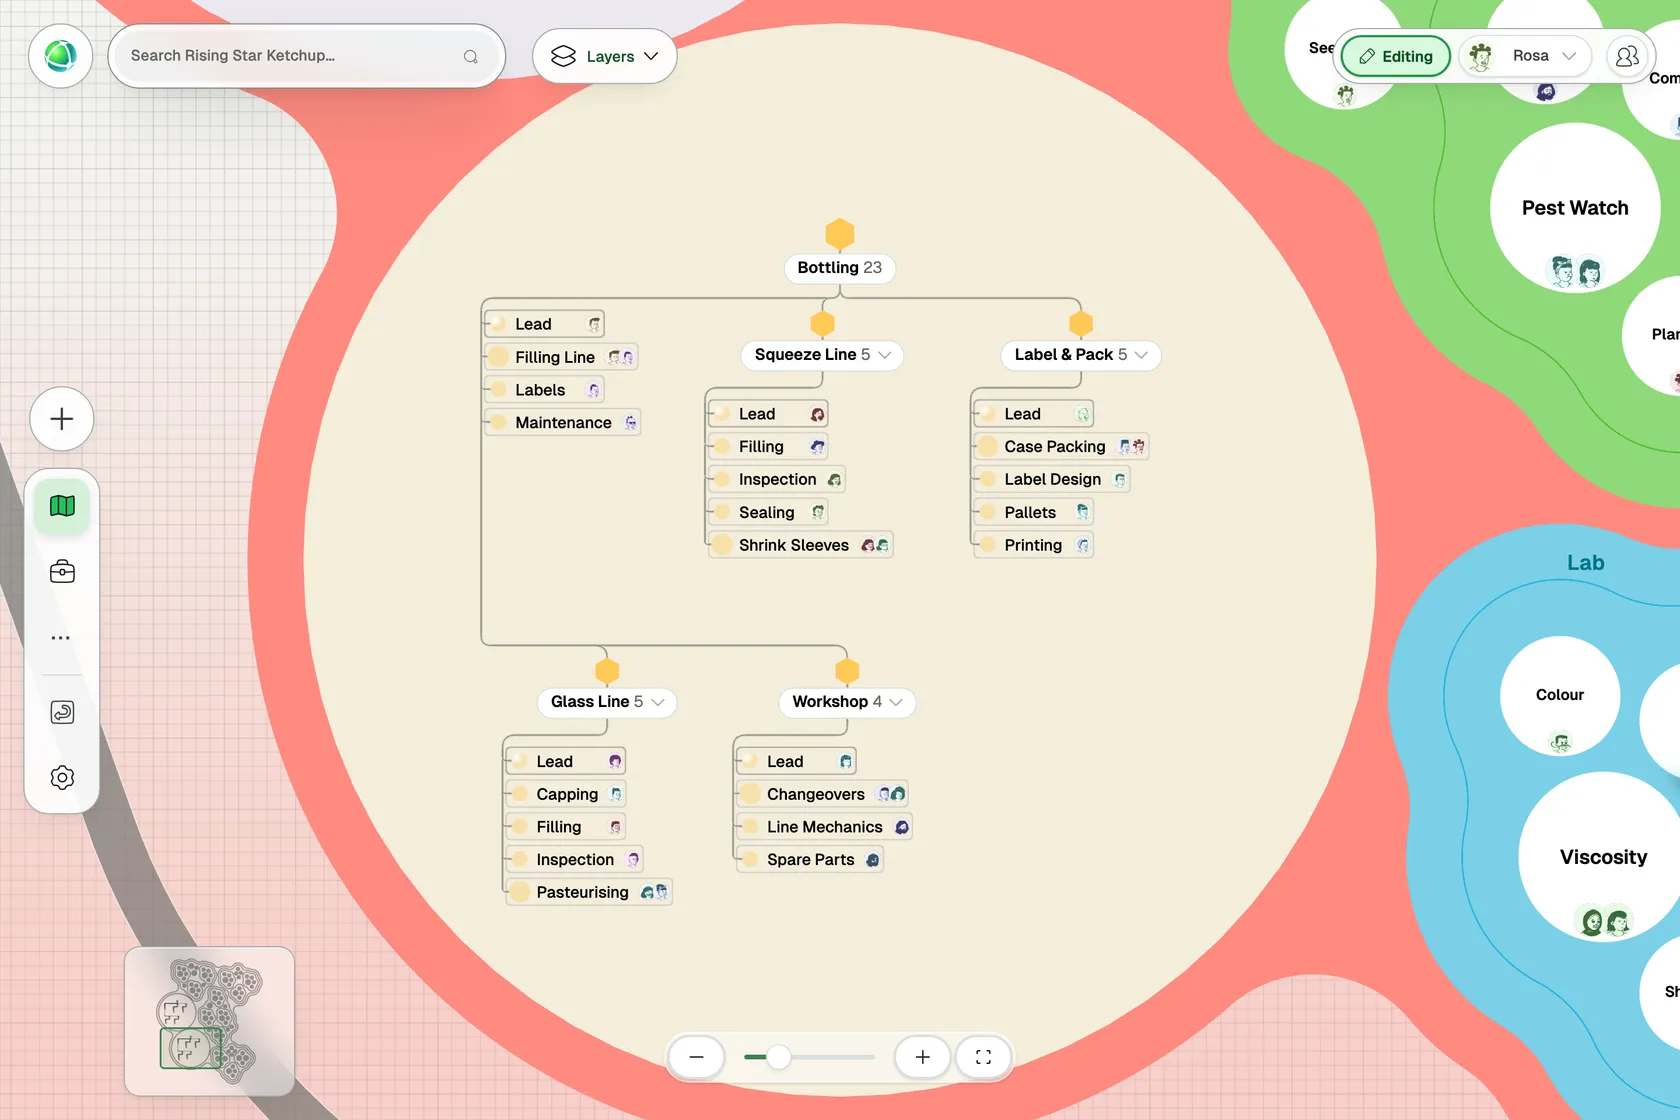
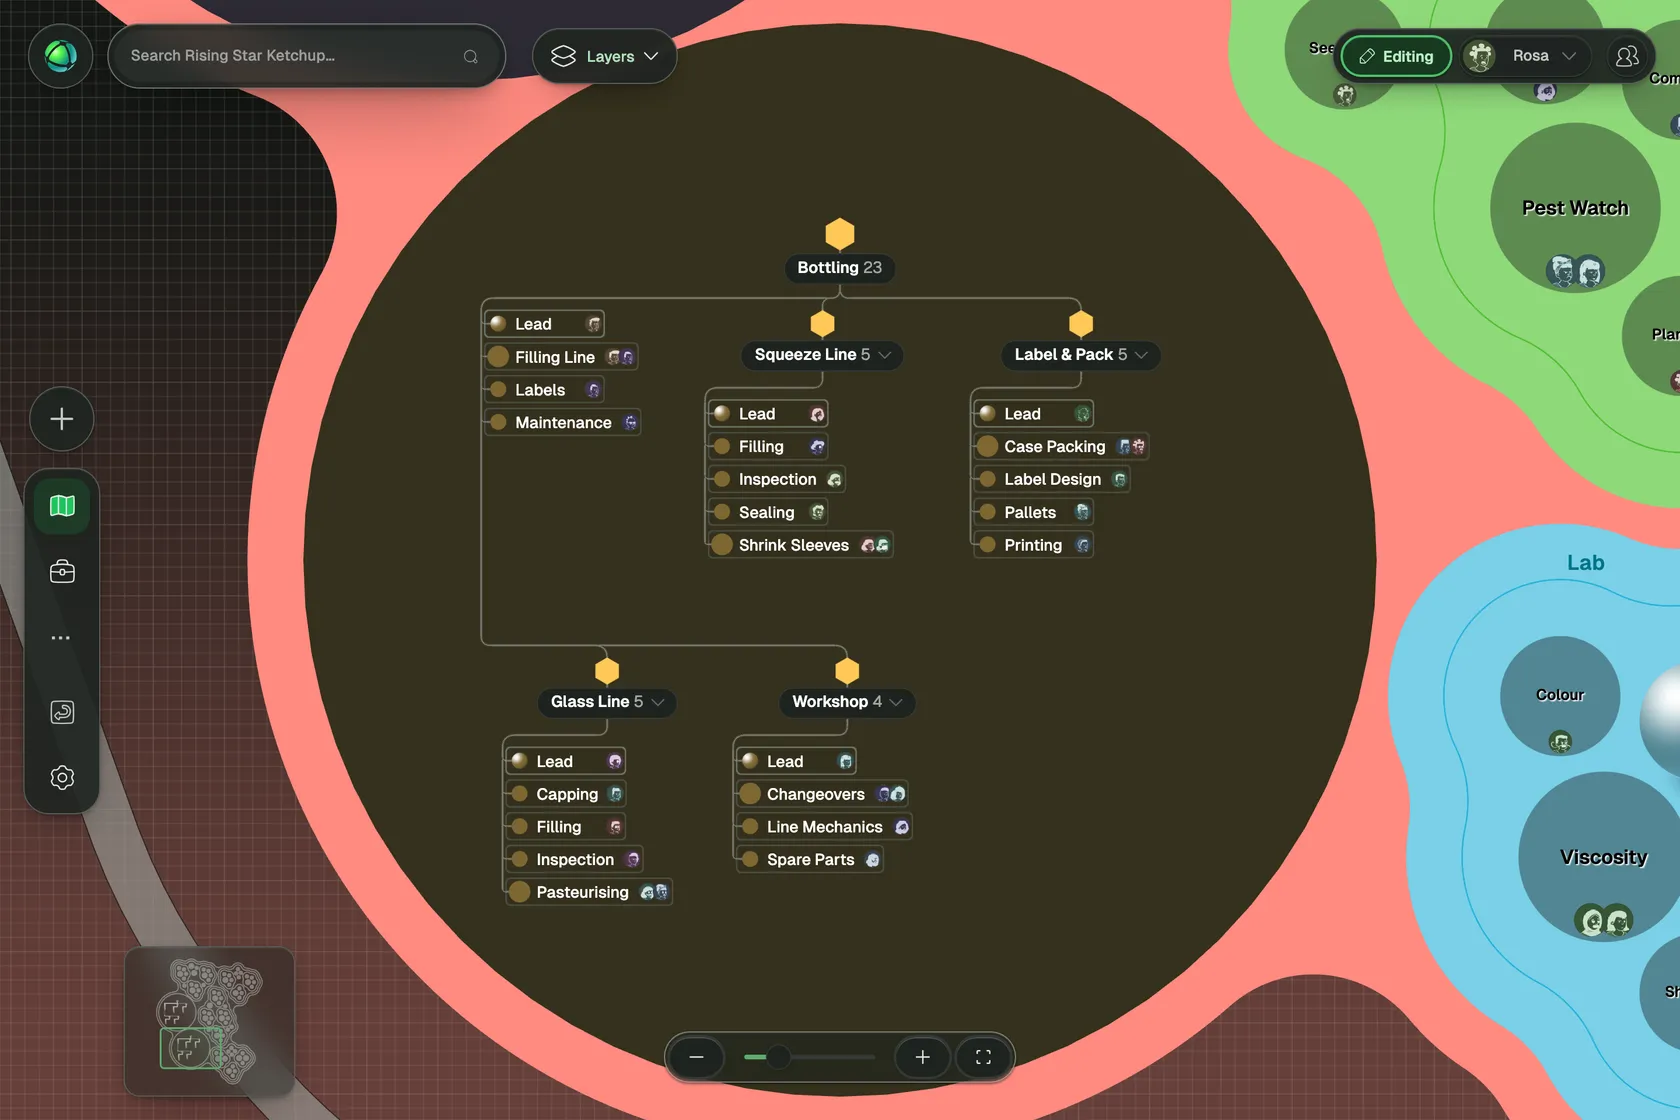
You can choose how much of each to show. Some organizations draw their entire reporting structure as an org chart with their project teams beside it. Others keep a hierarchy only in the departments that run on one. Your data stays the same in every layout, so you can change your mind later.
What each person sees
This is where the map pays off for the people on it.
When you hover over a colleague, the map highlights every position and role they hold, in the org chart and across every other team. At a glance, you see where they sit in the reporting line and everywhere else they contribute.
In their profile, their job position and their roles appear together, each showing the group it belongs to. This sends a clear message about how to understand your work: you are both your job title and a collection of roles. You can also add a Job Title field and a Line Manager field to the profile for additional clarity.
Now, anyone can answer the questions that used to be scattered across multiple systems. Where is my home team? Who do I report to? What else am I working on, and with whom? Who should I talk to about this?
How to set it up
- Model your organization as groups on one map. If you already use two groups, one for positions and one for roles, you are ready.
- Open the group that holds your reporting lines, go to its Design tab and choose Org Chart.
- Create your cross-functional work as projects for the whole organization in the Projects app, and add the roles that take part.
- Turn on the Projects layer to see the outline around the map, and select a project to see who is in it.
The step-by-step guide is in the documentation: Group layouts. Agree early on two things the map makes visible and leaves to you: how people split their time between their team and their projects, and who decides what when the two meet.
Group layouts are part of every plan, including the free Peerdom plan. The Projects app is an add-on for Peerdom+, and you can try it first. Peerdom is a Swiss company, and our data processing agreement describes where data is processed and lists our current sub-processors.
Common questions
Can we keep our org chart and work in roles? Yes. Your reporting lines show as an org chart, your roles and projects show next to it, and each person appears in both, on the same map.
What is a dual operating system? A model by John Kotter in which an organization runs two systems at once: a hierarchy for reliable daily operations and a network of volunteers for strategic change. The network supplements the hierarchy, and the two work side by side.
Do people need two tools to see both? One map is enough. One person has one profile, with their position in the hierarchy and their roles in the rest of the organization.
Where do I see who someone reports to? In the org chart on the map. Add a Line Manager field to your organization, and it also appears on every profile.
Does this work for mergers and acquisitions? Yes. Put the acquired company on your map as a group and draw it as the org chart it is. Integration projects then run around both companies. See our article on acquisitions.
Rising Star Ketchup Co. is a fictional demo company used to illustrate this article. Every name in the screenshots is fictional.