An actionable dashboard
Discover how work is spread across teams with powerful insights. Spot who’s overloaded or underutilized, uncover workload trends, and take data-backed actions to keep your team productive and balanced.
Uncover hidden patterns to drive meaningful change.
Diagnose issues in your organization, from staff turnover to bottlenecks and workload imbalances. Identify areas to improve in work distribution, team structure, and governance to keep things running smoothly and help your team succeed.
Add it to your map See pricing Included in Peerdom+. On Peerdom, try it free for 15 days. Hosted in Switzerland.
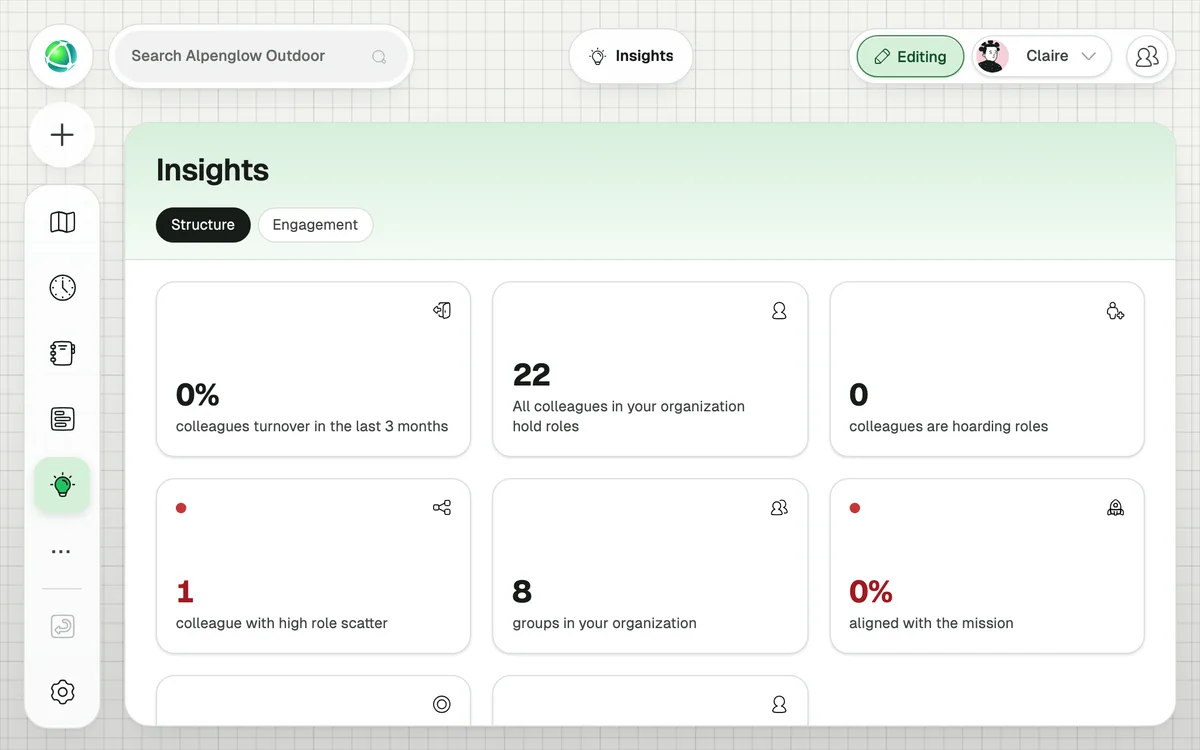
Discover how work is spread across teams with powerful insights. Spot who’s overloaded or underutilized, uncover workload trends, and take data-backed actions to keep your team productive and balanced.
View productivity risks as a heat-map layer on your org chart. Reveal where team members are stretched across too many areas. Dive deeper to pinpoint workload imbalances and optimize task distribution.
View a heat-map on your org chart to uncover individuals overloaded with roles, which can slow down decision-making. Reassign tasks to eliminate bottlenecks and improve workflow efficiency.
It overlays analytical data directly on your org map, helping you spot patterns like unstable roles, scattered workloads, and overloaded team members: like a health check for your organization.
Three: Role Turnover (identifies roles with frequent personnel changes), Cell Scatter (spots teams whose members are spread too thin), and Role Hoarding (highlights where single individuals hold too much decision-making power).
+1 CHF per user per month on top of your Peerdom+ subscription.
As color-coded overlays on the map. Each insight uses a different color scale (e.g., blue-to-red for turnover, yellow-to-brown for role hoarding) with a legend explaining the colors.
Yes. The Insights dashboard shows aggregate statistics: total cells, roles, roles per person, people hoarding roles, turnover percentage, and people with high role scatter. Clickable cards reveal ranked details.
Role Turnover uses 3 months of history. Cell Scatter and Role Hoarding use current role assignments.
Insights adds the Journal app for you when you install it, because that is where the historical record of your organization lives. Insights reads that history to show how your structure changed over time.